INTRODUCTION
The United States is a Federal Republic. The states have a significant amount of reserved powers. A state can decide on whether it has the death penalty or not for example. The head of state government is the Governor. This page looks at state governors in 3 different years over the span of nearly 70 years to look at how the composition of the Governors have changed. The 3 charts look at the composition of US governors by party, gender and military service.
Charts
1. US Governors in 1950, 1985 & 2019 by party
2. US Governors in 1950, 1985 & 2019 by Gender
3. Percentage of Male Governors with Military Service
4. National Popularity of Governors of 3 Most Populated States
Data Table
5. US Governors in 1950, 1985 and 2019 by Party and Gender
This chart shows a clear political shift in U.S. governorships over time. In both 1950 and especially 1985, the Democratic Party dominated at the state level, holding around 70% of governorships at its peak. This reflected a broader national pattern, as Democrats also controlled Congress for much of this period. Importantly, much of this dominance came from the South, where conservative Democrats still held power following the legacy of the New Deal and earlier political alignments.
However, by 2019 the balance had shifted, with Republicans holding more governorships. This change is largely explained by the political realignment of the South, where states that once reliably elected Democratic governors gradually became strongholds of the Republican Party.
This transformation reflects deeper ideological sorting between the parties, with conservatives consolidating within the Republicans and liberals within the Democrats.
Overall, the chart highlights how state-level political control has mirrored broader national realignments, particularly the long-term shift of the South from Democratic to Republican dominance.
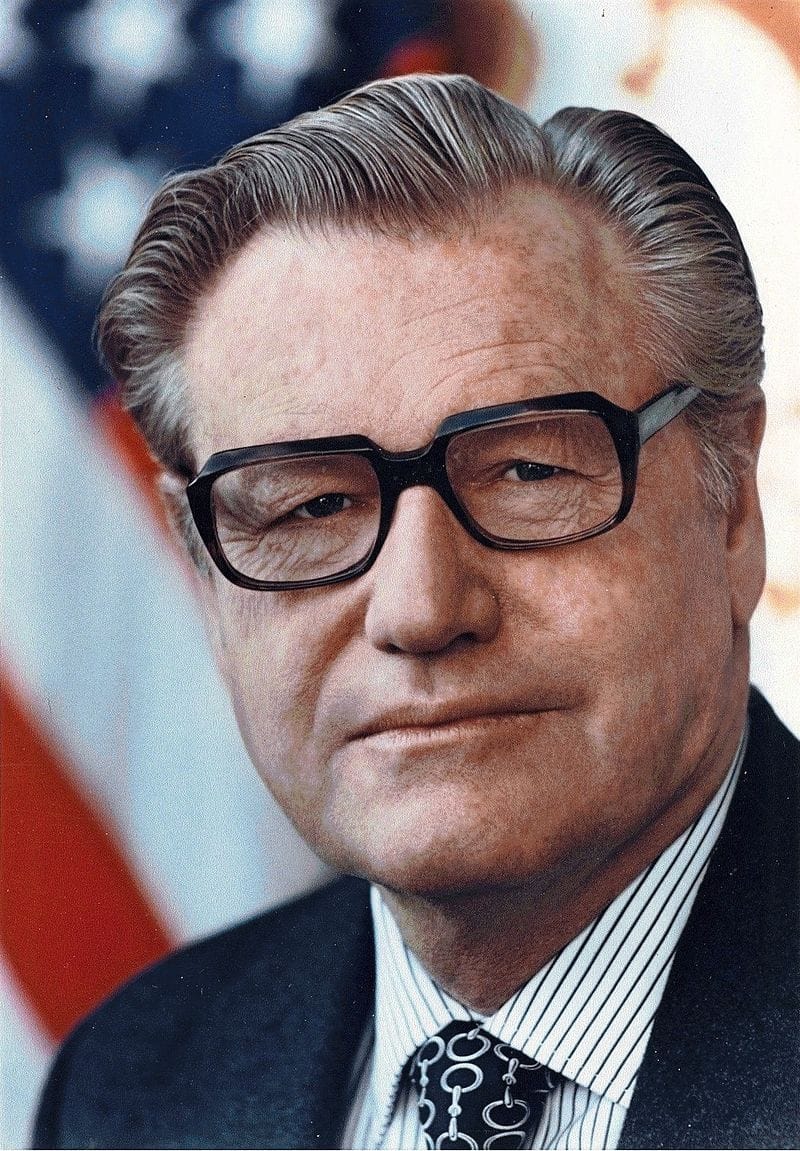
Nelson Rockefeller was a Republican Governor of New York from 1959 – 1973 at a time when most Governors in the United States were Democrats.
Representation for women in Governor positions has increased alongside improvements in representation of women in US politics in general. Today, around 20% of Governors are women. There were none in 1950. There wasn’t much change from 1950 to 1985. The majority of the female Governors are from the Democratic party.
The first female governor was Nellie Ross who became governor of Wyoming on January 5th 1925. She was the widow of Governor William B. Ross. The first female governor who wasn’t the widow or wife of a previous governor was Ella T. Grasso. She was became governor of Connecticut on 8th January 1975.
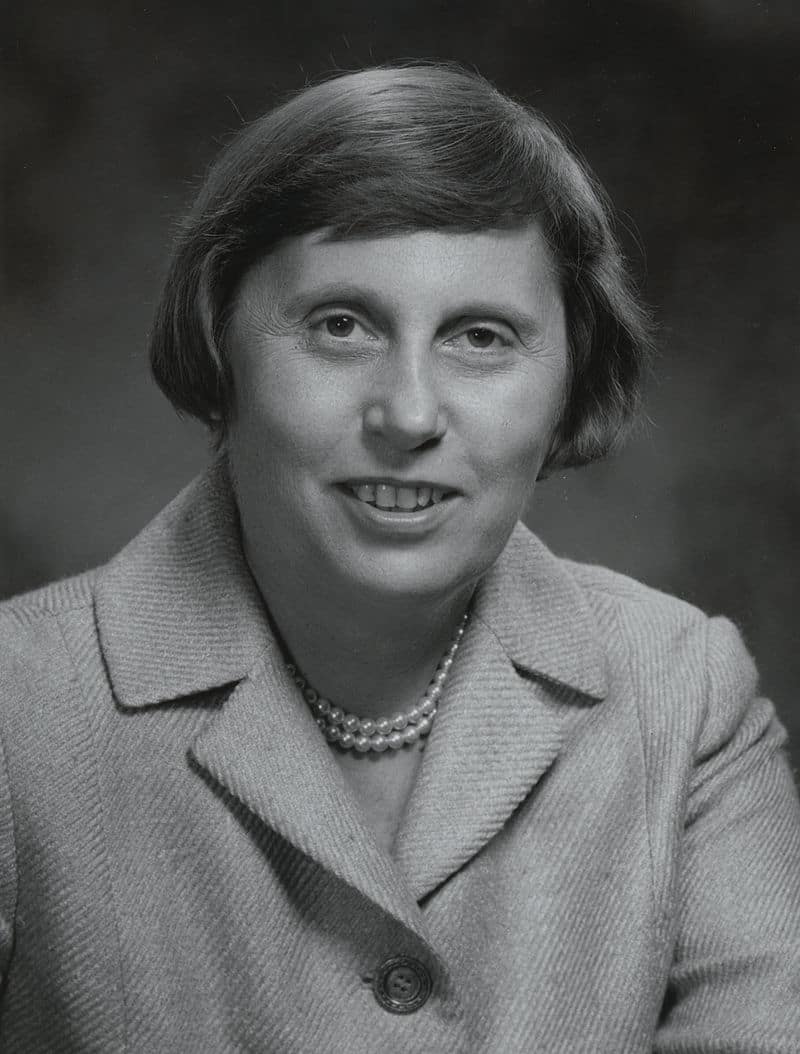
Ella T. Grasso was the first female governor who wasn’t the wife or widow of a previous governor. She became governor of Connecticut on 8th January 1975.
Far more Governors used to have military service records in 1950 and 1985 than presently. This is in part a reflection of opportunity to serve since WW2 had far more participation from the US population compared to recent wars and none of the current Governors would be old enough to have served in WW2. However, that doesn’t fully explain the difference. There has been a change in culture where the importance of having a military background for executive positions has become less important. This is reflected at the national level where the last two Republican Presidents, George W Bush and Donald Trump, have been draft evaders.
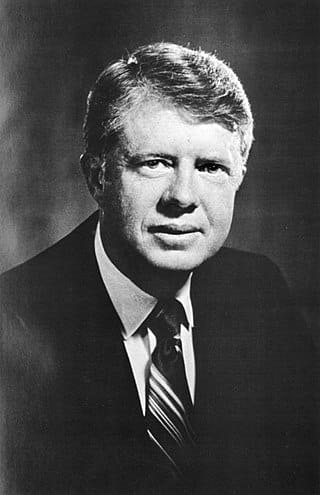
Jimmy Carter, who was Governor of Georgia from 1971 – 1975, had a background of military service.
This chart compares the national popularity of the governors of the three most populous U.S. states—California, Texas, and Florida—and highlights how these figures often serve as potential presidential candidates. Historically, governorships have been a strong stepping stone to the presidency, with figures like Ronald Reagan, George W. Bush, and Bill Clinton all following this path.
Gavin Newsom stands out as the most nationally liked among the three, with a clear positive gap between approval and disapproval. This positions him as a strong potential contender for future presidential races, particularly as a leading Democrat with high visibility from governing California.
In contrast, Greg Abbott shows more mixed national perceptions, while Ron DeSantis appears highly polarising, with equal levels of like and dislike. This reflects how governors of large states often build strong support within their political base, but may divide opinion nationally.
Overall, the chart illustrates how state-level leadership, especially in major states, can translate into national political relevance, though broader appeal varies significantly by political positioning.
DATA TABLE
5. US Governors in 1950, 1985 and 2019 by Party and Gender
OTHER PAGES ABOUT POLITICS & WORLD AFFAIRS
Sources:
charts created using openoffice calc