
This page compares military equipment across countries and world groups, focusing on naval tonnage, aircraft and combat tanks. These inventories reveal different national priorities: some countries maintain large land forces, while others place greater emphasis on air power or maritime reach. Naval tonnage adds useful perspective because a large carrier or submarine contributes far more displacement than a small patrol boat. Aircraft, artillery and tank figures provide complementary views of armed forces, alongside historical wartime production and nuclear arsenals. Together, the comparisons explore the scale and distribution of military equipment without treating any single total as a complete measure of military strength.
Updated 9 October 2026. Equipment: GFP 2026 estimates; population and steel: 2025; nuclear inventories: January 2026.
Statistics
- Military aircraft by world group, 2026
- Military aircraft per million people by world group
- Naval tonnage in the ten largest economies, 2026
- Naval tonnes per million people in the ten largest economies
- Aircraft and tanks in countries with over 100 million people
- Combat tanks per million people in the ten largest economies
- Military aircraft per million people in the ten largest economies
- Self-propelled and towed artillery in the ten largest economies
- Aircraft production during the Second World War, 1939–1945
- Nuclear arsenals, population and steel production
- The ten largest combat-tank inventories, 2026
- The ten largest fighter and interceptor fleets, 2026
- The ten largest submarine inventories, 2026
- Aircraft carriers and helicopter carriers by country, 2026
- The ten largest multiple-launch rocket-system inventories, 2026
Military aircraft by world group, 2026
The English-speaking group has by far the largest combined aircraft inventory, with 14,429 aircraft. The United States accounts for most of that total, supported by smaller but technologically advanced forces in the United Kingdom, Canada and Australia. American air power extends across the air force, navy, army and marine corps, giving it an unusually broad mixture of combat, transport, training and helicopter fleets. This concentration reflects the country’s long investment in the ability to operate across several continents.
The Middle East and North Africa follows with 7,814 aircraft, ahead of Eastern Europe and the former Soviet Union. The latter group retains large inventories associated with Russia and the military inheritance of the Cold War. Other East and Southeast Asian countries also possess substantial fleets, including those of Japan and the two Koreas. Western and Northern Europe has fewer aircraft in aggregate, but includes major aerospace producers and closely integrated NATO air forces. South Asia’s large population contrasts with a comparatively smaller combined fleet.
Sources: Global Firepower: 2026 air inventories.
GFP 2026 estimated inventories, including equipment beyond front-line service; these are not independently audited readiness counts. The nine analytical groups cover 144 GFP-listed countries with population data, not every country worldwide. Membership is supplied in the supporting table; this is not a uniform geographical classification. Somalia is omitted because its 2025 World Bank population value is unavailable.
Military aircraft per million people by world group
Population makes the contrasts between these groups more pronounced. The English-speaking group has about 29 aircraft per million people, well above Eastern Europe and the former Soviet Union at roughly sixteen. The difference reflects both the size of the American fleet and the resources available to several relatively affluent countries. Russia’s extensive inventory keeps its wider group in second place despite the very different circumstances of the countries included alongside it.
Western and Northern Europe and the Middle East and North Africa are much closer, at around twelve aircraft per million people. In the Middle East, security tensions and long-standing purchases from foreign manufacturers have supported substantial fleets in several states. European countries combine national forces with shared alliance arrangements and specialised capabilities. South Asia and Sub-Saharan Africa have considerably lower rates. Large populations, constrained budgets and competing development priorities help explain that contrast, although a small inventory can still serve important territorial, transport and surveillance needs.
Sources: Global Firepower: 2026 air inventories; World Bank: population, 2025.
GFP 2026 estimated inventories, including equipment beyond front-line service; these are not independently audited readiness counts. The nine analytical groups cover 144 GFP-listed countries with population data, not every country worldwide. Membership is supplied in the supporting table; this is not a uniform geographical classification. Somalia is omitted because its 2025 World Bank population value is unavailable. Rates use 2025 World Bank population; Taiwan uses the GFP population estimate. Equipment and population therefore have different reference dates.
Naval tonnage in the ten largest economies, 2026
The United States remains far ahead in naval tonnage, with about 8.27 million tonnes in the cited inventory. China follows at 3.19 million tonnes, while Russia has around 1.43 million. The American fleet’s scale reflects a longstanding commitment to global maritime operations, including large aircraft carriers, submarines, amphibious ships and support vessels. Its position dates back to the expansion of US naval power during the Second World War and its continued importance throughout the Cold War.
China is now clearly ahead of Russia in this comparison, correcting the older picture of similarly sized fleets. Its naval expansion has made maritime power increasingly central to the balance in East Asia. Japan and India follow among these ten economies, while France and the United Kingdom retain sizeable fleets with responsibilities extending beyond their home waters. Britain’s historical role as the leading naval power has given way to a smaller contemporary fleet, although its carriers and submarines remain important elements of national defence.
Sources: Global Firepower: 2026 navy inventories; IMF: April 2026 WEO, projected purchasing-power-parity GDP.
GFP 2026 estimated inventories, including equipment beyond front-line service; these are not independently audited readiness counts. Country selection: ten largest projected 2026 PPP economies in the April 2026 IMF WEO. GFP tonnage includes auxiliary vessels; its broader coverage is not directly comparable with the older GlobalSecurity figures.
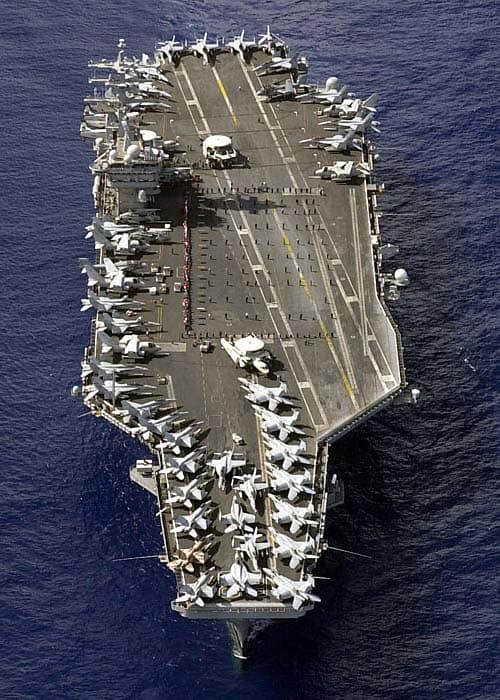
USS Nimitz is a nuclear-powered aircraft carrier commissioned in 1975 and named after Fleet Admiral Chester W. Nimitz. With a full-load displacement exceeding 100,000 long tons, it became one of the most recognisable symbols of American naval power. Its scale allows it to carry an air wing, support extensive flight operations and serve as a major component of a carrier strike group.
Two nuclear reactors provide propulsion, allowing long periods of operation between refuelling. The ship can exceed thirty knots and carries thousands of sailors and aviation personnel, making it comparable to a small floating town. Its aircraft and supporting facilities have served in a wide range of military operations, while carrier groups can also contribute to humanitarian responses.
Nimitz’s long career spans several generations of naval aviation. In July 2026 it arrived at Naval Station Norfolk, described by the US Navy as its final homeport, after completing its Southern Seas deployment. That milestone places the ship’s history in the context of a fleet gradually passing responsibilities to newer carriers.
Naval tonnes per million people in the ten largest economies
The United States also leads after allowing for population, with roughly 24,000 naval tonnes per million people. Russia follows at almost 10,000, while France, Japan and the United Kingdom form a closer middle group. Their positions reflect the importance of maritime forces to countries with overseas interests, exposed sea routes or extensive coastal responsibilities. France and Britain maintain naval capabilities that reach well beyond what their population sizes alone might suggest.
China’s much larger population lowers its relative position, despite its second-place total tonnage. India and Indonesia likewise have significant fleets spread across very large populations. Both face substantial maritime responsibilities: India borders major Indian Ocean routes, while Indonesia’s archipelagic geography makes naval access and patrol especially important. Germany and Brazil have smaller tonnage rates within this selection. The comparison brings out a difference between possessing one of the world’s largest fleets and devoting a large naval inventory to a relatively small population.
Sources: Global Firepower: 2026 navy inventories; World Bank: population, 2025; IMF: April 2026 WEO, projected purchasing-power-parity GDP.
GFP 2026 estimated inventories, including equipment beyond front-line service; these are not independently audited readiness counts. Rates use 2025 World Bank population; Taiwan uses the GFP population estimate. Equipment and population therefore have different reference dates. The economy selection uses projected 2026 PPP GDP. Tonnage includes auxiliaries and is not a measure of combat effectiveness.
Aircraft and tanks in countries with over 100 million people
The United States has an exceptional lead in aircraft among the most populous countries, with 13,032 in the 2026 inventory. Russia follows with 4,237 and China with 3,529. These fleets include the supporting aircraft and helicopters that allow large armed forces to move personnel, supply operations and train crews, alongside combat aircraft. American air power therefore combines numerical scale with a wide range of functions, rather than depending only on fighter numbers.
Tank inventories present a different balance. China leads this selection with 5,870 tanks, followed by Russia with 5,630 and the United States with 4,666. India and Egypt also have sizeable armoured forces, reflecting the continuing importance of land warfare in their military planning. Other highly populated countries have much smaller equipment totals. Nigeria, Ethiopia and Bangladesh illustrate how population alone does not determine the size of an armed force’s heavy inventory: financial resources, perceived threats and strategic priorities all influence the resulting balance.
Sources: Global Firepower: 2026 air inventories; Global Firepower: 2026 tanks inventories; World Bank: population, 2025.
GFP 2026 estimated inventories, including equipment beyond front-line service; these are not independently audited readiness counts. Sixteen countries have at least 100 million people in the 2025 population dataset. Aircraft means all military aircraft, not combat aircraft alone. DR Congo is the Democratic Republic of the Congo.
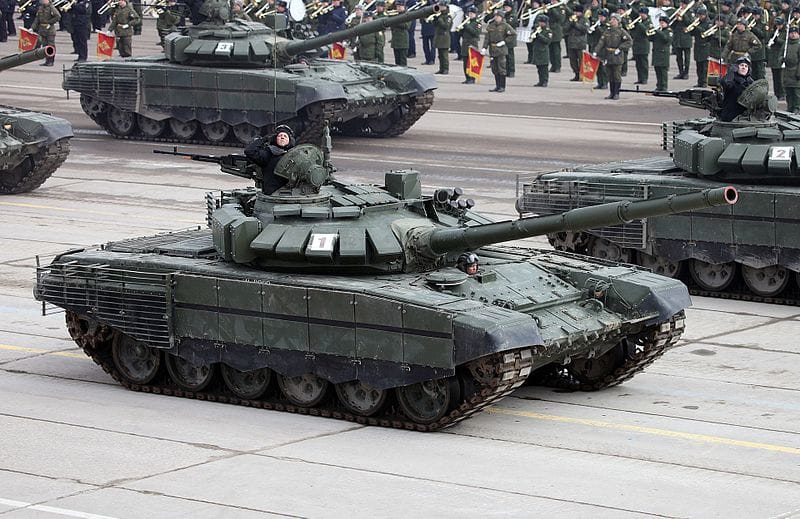
The T-72 is a Soviet-designed main battle tank introduced in the 1970s and subsequently produced and operated in many countries. Its relatively low profile, 125 mm main gun and automatic loading system distinguish it from several contemporary Western designs. The autoloader allows a three-person crew, while the tank’s widespread adoption made it an important part of Cold War armoured forces.
Numerous variants and modernisation programmes have followed, improving armour protection, sighting systems and other equipment. Its long service history reflects both the scale of original production and the practicality of updating existing vehicles. Today, the T-72 family remains a prominent example of how older tank designs can persist in national inventories alongside newer models.
Combat tanks per million people in the ten largest economies
Russia has the highest tank inventory relative to population among the ten selected economies, with about 39 tanks per million people. The United States follows at roughly fourteen, while China has just over four. Russia’s position reflects a long military tradition in which armoured forces play a central role. The Soviet Union maintained large formations for land warfare, and that emphasis remains visible in the equipment recorded for its largest successor state.
Japan, India and the major Western European economies have considerably lower rates. Their armies have different territorial responsibilities, force structures and approaches to armoured warfare, while naval and air capabilities absorb substantial resources in several cases. Tanks remain important for protected mobility and firepower, but their role is increasingly shaped by drones, anti-tank weapons and the need for closely coordinated support. The numerical lead of one country consequently does not describe every aspect of the balance between armies, particularly where equipment age and training differ.
Sources: Global Firepower: 2026 tanks inventories; World Bank: population, 2025; IMF: April 2026 WEO, projected purchasing-power-parity GDP.
GFP 2026 estimated inventories, including equipment beyond front-line service; these are not independently audited readiness counts. Rates use 2025 World Bank population; Taiwan uses the GFP population estimate. Equipment and population therefore have different reference dates. Older stored-stock estimates and these 2026 figures use different coverage; their difference should not be read as a count of battlefield losses.
Military aircraft per million people in the ten largest economies
The United States leads the selected economies with about 38 military aircraft per million people. Russia follows at around thirty, and France is third. These positions reflect the size of their fleets relative to their populations as well as their substantial aerospace industries. France’s rate is particularly notable because its total inventory is far smaller than those of the United States, Russia or China, yet its population is also considerably smaller.
The United Kingdom and Germany remain ahead of the much more populous Asian economies on this measure. China and India have large absolute fleets, but their populations exceed 1.4 billion, producing lower aircraft rates. Japan occupies a middle position, with a significant air force concentrated on regional defence. Across the comparison, countries balance combat aircraft with transport, training and helicopter fleets in different ways. The figures highlight the unusually extensive American and Russian aviation inventories, while leaving room for smaller fleets whose modern systems and specialised roles give them considerable significance.
Sources: Global Firepower: 2026 air inventories; World Bank: population, 2025; IMF: April 2026 WEO, projected purchasing-power-parity GDP.
GFP 2026 estimated inventories, including equipment beyond front-line service; these are not independently audited readiness counts. Rates use 2025 World Bank population; Taiwan uses the GFP population estimate. Equipment and population therefore have different reference dates. Includes helicopters, trainers, transports and other support aircraft as well as combat aircraft.
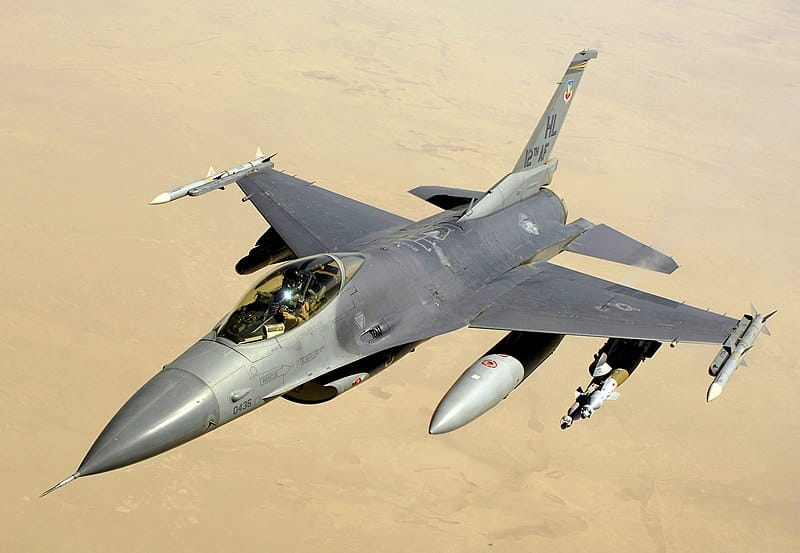
The F-16 Fighting Falcon is a single-engine multirole fighter that entered service in the late 1970s. Originally developed for the United States Air Force, it became widely used by allied and partner countries. Its agility, bubble canopy and adaptable design helped establish it as one of the most familiar combat aircraft of the modern era.
The aircraft has served in air-to-air and ground-attack roles, with successive upgrades to avionics, weapons compatibility and other systems extending its working life. Its international spread also reflects the importance of training, maintenance and long-term supplier relationships in military aviation. Decades after its introduction, the F-16 remains an important element of many air forces.
Self-propelled and towed artillery in the ten largest economies
Russia has the largest artillery inventory among these ten economies, with 3,603 self-propelled systems and 5,920 towed pieces or heavy mortars in the cited categories. India follows closely in the second category with 5,640, while China combines 2,940 self-propelled systems with 1,400 towed pieces. The distribution reflects the continuing importance of artillery to large land forces, especially those planning for extensive continental operations.
The balance between the two categories varies considerably. Self-propelled systems combine a gun with a vehicle, allowing crews to move more rapidly between firing positions. Towed equipment can be less costly and easier to sustain, but depends on separate transport. Western European inventories are much smaller than the leading Asian and Russian totals, consistent with smaller armies and different force structures. Recent warfare has renewed attention to artillery, ammunition supply and mobility, reinforcing that the effectiveness of these forces depends on sustained support as well as the number of weapons available.
Sources: Global Firepower: 2026 spa inventories; Global Firepower: 2026 towed inventories; IMF: April 2026 WEO, projected purchasing-power-parity GDP.
GFP 2026 estimated inventories, including equipment beyond front-line service; these are not independently audited readiness counts. GFP’s towed category includes heavy mortars of 120 mm or greater; it is not a pure howitzer count. Multiple-launch rocket systems appear separately below.
Aircraft production during the Second World War, 1939–1945
Aircraft production expanded dramatically as the Second World War became a prolonged industrial struggle. The United States rose from just over 2,000 aircraft in 1939 to more than 96,000 in 1944 in this historical series. Its growth illustrates the scale of American industrial mobilisation, which supplied its own armed forces and supported Allied partners. Britain and the Soviet Union also expanded production substantially, maintaining major aircraft industries despite direct attacks and the disruption of war.
Germany’s output peaked later in the conflict, reaching almost 40,000 aircraft in 1944, while Japan also recorded its highest annual total that year. Those increases were insufficient to overcome the wider Allied advantage in industrial resources and supply. France’s early figures belong to the period before its defeat in 1940, and Italy’s reported series ends after 1943. By the war’s final years, the United States stood well ahead of the other countries shown, demonstrating how productive capacity became a decisive element of sustained air warfare.
Sources: Historical aircraft-production series; Aircraft Industries Association: 1948 Aircraft Year Book.
Historical compilation retained, not a present-day inventory. National series differ in aircraft coverage and wartime reporting. Unreported French 1941–45 and Italian 1944–45 cells are gaps, not claims of zero production. US totals are broader annual production figures, not the AAF’s military-only January–August 1945 series.
Nuclear arsenals, population and steel production
Russia and the United States remain in a different category from the other nuclear-armed states. SIPRI estimates their total inventories at 5,420 and 5,042 warheads respectively in January 2026. Their arsenals are the legacy of decades of competition during and after the Cold War. China’s estimated 620 warheads form the next-largest inventory, but remain far below those accumulated by the two established nuclear superpowers.
The industrial and population comparisons reveal contrasting national profiles. China combines a very large population with high steel output per person, whereas India has a similarly large population but much lower steel production per head. Russia’s steel rate also exceeds that of the United States, despite its smaller population. France and the United Kingdom have smaller nuclear inventories, while Pakistan and Israel occupy different positions again. These contrasts underline how nuclear arsenals reflect strategic choices and historical commitments, rather than following directly from population size or one measure of industrial production.
Sources: SIPRI Yearbook 2026: nuclear forces in January 2026; World Steel Association: World Steel in Figures 2026, production in 2025; World Steel Association: annual steel production data; World Bank: population, 2025.
Warheads: total inventories, including retired weapons awaiting dismantlement, January 2026 estimates. Population and steel: 2025. North Korea remains in the nuclear table but is omitted here because a reliable 2025 steel figure was not verified. Steel output does not measure overall industrial or military capability.
The ten largest combat-tank inventories, 2026
China leads the worldwide tank inventory with 5,870 vehicles, ahead of Russia’s 5,630. North Korea follows with 4,895, slightly more than the United States at 4,666. The leading group includes countries with very different economies and military systems, but all have maintained substantial armoured forces. China and Russia place tanks within large continental armies, while North Korea’s position reflects a longstanding concentration on land forces on the Korean peninsula.
India and Egypt occupy the next places, followed by Pakistan, Iran, Turkiye and Vietnam. Their presence extends the comparison well beyond the largest global economies and highlights the importance of regional security concerns. Several maintain sizeable fleets assembled over many years, including older vehicles alongside more recent models. Tanks continue to provide protected firepower, but the demands placed on them have changed as surveillance drones and precision weapons become more widespread. Maintaining armour, supporting crews and integrating other forces remain central challenges for countries with large inventories.
Sources: Global Firepower: 2026 tanks inventories.
GFP 2026 estimated inventories, including equipment beyond front-line service; these are not independently audited readiness counts.
The ten largest fighter and interceptor fleets, 2026
The United States has the largest fighter and interceptor fleet in the 2026 inventory, with 1,791 aircraft, followed by China with 1,443 and Russia with 861. The gap is narrower than in the comparison of all military aircraft, where the American total includes a particularly large supporting fleet. These three countries also possess extensive domestic aircraft industries, allowing them to design and manufacture successive generations of combat aircraft.
India follows with 476 fighters and interceptors, while North Korea, Pakistan and Saudi Arabia occupy the next positions. Taiwan, Egypt and South Korea complete the ten, with the latter two level on 242. Their fleets reflect regional defence requirements as well as differing relationships with overseas suppliers. Some countries operate a wide mixture of aircraft ages and designs, while others have concentrated on fewer modern types. The pattern demonstrates that combat aviation is widely distributed, even though the largest manufacturing powers retain a substantial numerical advantage over the rest.
Sources: Global Firepower: 2026 fighters inventories.
GFP 2026 estimated inventories, including equipment beyond front-line service; these are not independently audited readiness counts. GFP fighter/interceptor category; dedicated ground-attack aircraft and other categories are excluded. Egypt and South Korea tie on 242.
The ten largest submarine inventories, 2026
Russia and the United States share the largest submarine inventory in the cited figures, with 66 boats each, followed closely by China with 61. Submarines are an important part of their naval forces because they can operate with a degree of concealment unavailable to surface ships. For these major powers, the category includes vessels assigned to different roles, including strategic deterrence and operations against other ships or submarines.
Iran and North Korea follow with 25 and 24 boats, while Japan and South Korea have 23 and 22. Their positions demonstrate the significance of undersea forces in both global and regional military planning. India, Turkiye and the United Kingdom complete the leading ten. The fleets differ greatly in vessel size, propulsion and mission: a small coastal submarine is not equivalent to a large nuclear-powered boat. Nevertheless, the distribution highlights the continuing appeal of submarines to countries seeking a substantial maritime capability without relying entirely on large surface fleets.
Sources: Global Firepower: 2026 subs inventories.
GFP 2026 estimated inventories, including equipment beyond front-line service; these are not independently audited readiness counts. Includes nuclear, diesel-electric and midget submarines; counts do not imply equivalent size, capability or availability.
Aircraft carriers and helicopter carriers by country, 2026
The United States has eleven aircraft carriers in the cited fleet category, together with nine helicopter carriers. Keeping those categories separate corrects the earlier impression that it possessed twenty comparable fleet aircraft carriers. Its large carriers provide a distinctive ability to sustain aviation far from home bases. China follows with three aircraft carriers, while India, Italy and the United Kingdom each have two in the source’s classification.
Helicopter carriers broaden the geographical distribution. Japan and China each have four, France has three, and Australia, Egypt and South Korea each have two. These vessels can support helicopters and amphibious operations, while some designs also accommodate other aircraft. The differences in ship size and aviation arrangements are substantial, so the two categories describe different kinds of naval capacity. Their spread reflects the importance of moving personnel, aircraft and equipment by sea, alongside the more concentrated ability to operate large fixed-wing aircraft carriers.
Sources: Global Firepower: 2026 carriers inventories; Global Firepower: 2026 helicopter carriers inventories.
GFP 2026 estimated inventories, including equipment beyond front-line service; these are not independently audited readiness counts. All countries with a non-zero entry in either category are included. GFP classifications are retained; Italy and Spain include smaller carrier types. Russia’s listed carrier is not evidence of a deployable carrier capability. Ship status and air wings are not assessed.
The ten largest multiple-launch rocket-system inventories, 2026
China has the largest multiple-launch rocket-system inventory in the 2026 figures, with 2,770 systems, followed by Russia with 2,486 and the United States with 1,731. Iran, Myanmar and North Korea also have substantial totals, each exceeding 1,500. The distribution differs from the leading aircraft and naval rankings, reflecting the prominence of rocket artillery within several armies focused on land warfare.
Sudan, Vietnam, Azerbaijan and Pakistan complete the leading ten. Rocket systems can deliver several projectiles in a short period, while newer designs may employ guided ammunition with much greater precision than older area-fire weapons. These developments have increased their importance in discussions of contemporary military capability. Large inventories can nevertheless include a broad mixture of system ages, ranges and ammunition types. The ranking highlights a particular form of land-based firepower whose production and maintenance requirements differ from those of advanced combat aircraft or major warships.
Sources: Global Firepower: 2026 mlrs inventories.
GFP 2026 estimated inventories, including equipment beyond front-line service; these are not independently audited readiness counts. Launchers, not rockets or ammunition stocks. Systems vary considerably in range, guidance, calibre and condition.
Equipment in the 25 most populous countries
Select a column heading to sort. A dash indicates an unavailable figure, not zero.
Open sortable supporting table
| Country | Population, 2025 | Aircraft, 2026 | Naval tonnes, 2026 | Tanks, 2026 | Aircraft per million | Naval tonnes per million | Tanks per million |
|---|---|---|---|---|---|---|---|
| India | 1463865525 | 2183 | 631989 | 3913 | 1.49 | 431.73 | 2.67 |
| China | 1406585000 | 3529 | 3192411 | 5870 | 2.51 | 2269.62 | 4.17 |
| United States | 341784857 | 13032 | 8265799 | 4666 | 38.13 | 24184.22 | 13.65 |
| Indonesia | 285721236 | 460 | 324754 | 331 | 1.61 | 1136.61 | 1.16 |
| Pakistan | 255219554 | 1397 | 115187 | 2677 | 5.47 | 451.33 | 10.49 |
| Nigeria | 237527782 | 159 | 38052 | 330 | 0.67 | 160.2 | 1.39 |
| Brazil | 212812405 | 495 | 166419 | 294 | 2.33 | 782.0 | 1.38 |
| Bangladesh | 175686899 | 212 | 75280 | 320 | 1.21 | 428.49 | 1.82 |
| Russia | 143513328 | 4237 | 1426539 | 5630 | 29.52 | 9940.12 | 39.23 |
| Ethiopia | 135472051 | 104 | 0 | 338 | 0.77 | 0.0 | 2.49 |
| Mexico | 131946900 | 424 | — | 0 | 3.21 | — | 0.0 |
| Japan | 123366734 | 1429 | 798062 | 734 | 11.58 | 6469.02 | 5.95 |
| Egypt | 118365995 | 1088 | 235989 | 3620 | 9.19 | 1993.72 | 30.58 |
| Philippines | 116786962 | 204 | 84578 | 18 | 1.75 | 724.21 | 0.15 |
| Democratic Republic of the Congo | 112832473 | 56 | — | 212 | 0.5 | — | 1.88 |
| Vietnam | 101598527 | 265 | 102147 | 1999 | 2.61 | 1005.4 | 19.68 |
| Iran | 92417681 | 551 | 283516 | 2675 | 5.96 | 3067.77 | 28.94 |
| Turkiye | 85878556 | 1101 | 349739 | 2284 | 12.82 | 4072.48 | 26.6 |
| Germany | 83491249 | 569 | 241492 | 296 | 6.82 | 2892.42 | 3.55 |
| Thailand | 71619863 | 496 | 133523 | 744 | 6.93 | 1864.33 | 10.39 |
| Tanzania | 70545865 | 38 | — | 200 | 0.54 | — | 2.84 |
| United Kingdom | 69487000 | 625 | 406308 | 288 | 8.99 | 5847.25 | 4.14 |
| France | 68720337 | 974 | 487471 | 427 | 14.17 | 7093.55 | 6.21 |
| South Africa | 64747319 | 181 | 43881 | 248 | 2.8 | 677.73 | 3.83 |
| Italy | 58915656 | 714 | 387892 | 203 | 12.12 | 6583.85 | 3.45 |
Regional group membership and aircraft totals
Select a column heading to sort. A dash indicates an unavailable figure, not zero.
Open sortable supporting table
| Country | Analytical group | Aircraft, 2026 | Population | Population reference |
|---|---|---|---|---|
| Afghanistan | South Asia | 5 | 43844111 | 2025 |
| Albania | Eastern Europe / former USSR | 20 | 2349580 | 2025 |
| Algeria | Middle East / North Africa | 620 | 47435312 | 2025 |
| Angola | Sub-Saharan Africa | 278 | 39040039 | 2025 |
| Argentina | Latin America / Caribbean | 241 | 45851378 | 2025 |
| Armenia | Eastern Europe / former USSR | 69 | 3086700 | 2025 |
| Australia | English-speaking group | 348 | 27614411 | 2025 |
| Austria | Western / Northern Europe | 90 | 9208163 | 2025 |
| Azerbaijan | Eastern Europe / former USSR | 159 | 10246996 | 2025 |
| Bahrain | Middle East / North Africa | 137 | 1600366 | 2025 |
| Bangladesh | South Asia | 212 | 175686899 | 2025 |
| Belarus | Eastern Europe / former USSR | 194 | 9085991 | 2025 |
| Belgium | Western / Northern Europe | 104 | 11941781 | 2025 |
| Beliz | Latin America / Caribbean | 3 | 422924 | 2025 |
| Benin | Sub-Saharan Africa | 7 | 14814460 | 2025 |
| Bhutan | South Asia | 2 | 796682 | 2025 |
| Bolivia | Latin America / Caribbean | 67 | 12581843 | 2025 |
| Bosnia and Herzegovina | Eastern Europe / former USSR | 15 | 3140095 | 2025 |
| Botswana | Sub-Saharan Africa | 45 | 2562122 | 2025 |
| Brazil | Latin America / Caribbean | 495 | 212812405 | 2025 |
| Bulgaria | Eastern Europe / former USSR | 71 | 6433302 | 2025 |
| Burkina Faso | Sub-Saharan Africa | 26 | 24074580 | 2025 |
| Cambodia | Other East / Southeast Asia | 24 | 17847982 | 2025 |
| Cameroon | Sub-Saharan Africa | 35 | 29879337 | 2025 |
| Canada | English-speaking group | 354 | 41651653 | 2025 |
| Central African Republic | Sub-Saharan Africa | 8 | 5513282 | 2025 |
| Chad | Sub-Saharan Africa | 40 | 21003705 | 2025 |
| Chile | Latin America / Caribbean | 274 | 19859921 | 2025 |
| China | Chinese-language group | 3529 | 1406585000 | 2025 |
| Colombia | Latin America / Caribbean | 430 | 53425635 | 2025 |
| Croatia | Eastern Europe / former USSR | 67 | 3876200 | 2025 |
| Cuba | Latin America / Caribbean | 20 | 10937203 | 2025 |
| Czechia | Eastern Europe / former USSR | 103 | 10886878 | 2025 |
| Democratic Republic of the Congo | Sub-Saharan Africa | 56 | 112832473 | 2025 |
| Denmark | Western / Northern Europe | 122 | 6009169 | 2025 |
| Dominican Republic | Latin America / Caribbean | 80 | 11520487 | 2025 |
| Ecuador | Latin America / Caribbean | 99 | 18289896 | 2025 |
| Egypt | Middle East / North Africa | 1088 | 118365995 | 2025 |
| El Salvador | Latin America / Caribbean | 51 | 6365503 | 2025 |
| Eritrea | Sub-Saharan Africa | 20 | 3607003 | 2025 |
| Estonia | Eastern Europe / former USSR | 2 | 1366475 | 2025 |
| Ethiopia | Sub-Saharan Africa | 104 | 135472051 | 2025 |
| Finland | Western / Northern Europe | 162 | 5646436 | 2025 |
| France | Western / Northern Europe | 974 | 68720337 | 2025 |
| Gabon | Sub-Saharan Africa | 25 | 2593130 | 2025 |
| Georgia | Eastern Europe / former USSR | 61 | 3935766 | 2025 |
| Germany | Western / Northern Europe | 569 | 83491249 | 2025 |
| Ghana | Sub-Saharan Africa | 18 | 35064272 | 2025 |
| Greece | Western / Northern Europe | 560 | 10413962 | 2025 |
| Guatemala | Latin America / Caribbean | 35 | 18687881 | 2025 |
| Honduras | Latin America / Caribbean | 45 | 11005850 | 2025 |
| Hungary | Eastern Europe / former USSR | 80 | 9514251 | 2025 |
| Iceland | Western / Northern Europe | 0 | 392404 | 2025 |
| India | South Asia | 2183 | 1463865525 | 2025 |
| Indonesia | Other East / Southeast Asia | 460 | 285721236 | 2025 |
| Iran | Middle East / North Africa | 551 | 92417681 | 2025 |
| Iraq | Middle East / North Africa | 360 | 47020774 | 2025 |
| Ireland | English-speaking group | 23 | 5484367 | 2025 |
| Israel | Middle East / North Africa | 597 | 10122800 | 2025 |
| Italy | Western / Northern Europe | 714 | 58915656 | 2025 |
| Ivory Coast | Sub-Saharan Africa | 22 | 32711547 | 2025 |
| Japan | Other East / Southeast Asia | 1429 | 123366734 | 2025 |
| Jordan | Middle East / North Africa | 279 | 11520684 | 2025 |
| Kazakhstan | Eastern Europe / former USSR | 168 | 20843754 | 2025 |
| Kenya | Sub-Saharan Africa | 154 | 57532493 | 2025 |
| Kosovo | Eastern Europe / former USSR | 0 | 1576876 | 2025 |
| Kuwait | Middle East / North Africa | 133 | 4865298 | 2025 |
| Kyrgyzstan | Eastern Europe / former USSR | 7 | 7343064 | 2025 |
| Laos | Other East / Southeast Asia | 29 | 7873046 | 2025 |
| Latvia | Eastern Europe / former USSR | 3 | 1847785 | 2025 |
| Lebanon | Middle East / North Africa | 80 | 5849421 | 2025 |
| Liberia | Sub-Saharan Africa | 0 | 5731206 | 2025 |
| Libya | Middle East / North Africa | 83 | 7458555 | 2025 |
| Lithuania | Eastern Europe / former USSR | 9 | 2888774 | 2025 |
| Luxembourg | Western / Northern Europe | 1 | 686970 | 2025 |
| Madagascar | Sub-Saharan Africa | 6 | 32740678 | 2025 |
| Malaysia | Other East / Southeast Asia | 132 | 35977838 | 2025 |
| Mali | Sub-Saharan Africa | 44 | 25198821 | 2025 |
| Mauritania | Middle East / North Africa | 23 | 5315065 | 2025 |
| Mexico | Latin America / Caribbean | 424 | 131946900 | 2025 |
| Moldova | Eastern Europe / former USSR | 3 | 2360527 | 2025 |
| Mongolia | Other East / Southeast Asia | 8 | 3568978 | 2025 |
| Montenegro | Eastern Europe / former USSR | 10 | 623129 | 2025 |
| Morocco | Middle East / North Africa | 271 | 38430770 | 2025 |
| Mozambique | Sub-Saharan Africa | 23 | 35631653 | 2025 |
| Myanmar | Other East / Southeast Asia | 331 | 54850648 | 2025 |
| Namibia | Sub-Saharan Africa | 36 | 3092816 | 2025 |
| Nepal | South Asia | 17 | 29618118 | 2025 |
| Netherlands | Western / Northern Europe | 130 | 18087633 | 2025 |
| New Zealand | English-speaking group | 47 | 5324700 | 2025 |
| Nicaragua | Latin America / Caribbean | 17 | 7007502 | 2025 |
| Niger | Sub-Saharan Africa | 26 | 27917831 | 2025 |
| Nigeria | Sub-Saharan Africa | 159 | 237527782 | 2025 |
| North Korea | Other East / Southeast Asia | 837 | 26571036 | 2025 |
| North Macedonia | Eastern Europe / former USSR | 20 | 1820909 | 2025 |
| Norway | Western / Northern Europe | 109 | 5610870 | 2025 |
| Oman | Middle East / North Africa | 128 | 5494691 | 2025 |
| Pakistan | South Asia | 1397 | 255219554 | 2025 |
| Panama | Latin America / Caribbean | 38 | 4571189 | 2025 |
| Paraguay | Latin America / Caribbean | 49 | 7013078 | 2025 |
| Peru | Latin America / Caribbean | 252 | 34576665 | 2025 |
| Philippines | Other East / Southeast Asia | 204 | 116786962 | 2025 |
| Poland | Eastern Europe / former USSR | 457 | 36435861 | 2025 |
| Portugal | Western / Northern Europe | 128 | 10804871 | 2025 |
| Qatar | Middle East / North Africa | 263 | 2972215 | 2025 |
| Republic of the Congo | Sub-Saharan Africa | 14 | 6484437 | 2025 |
| Romania | Eastern Europe / former USSR | 148 | 19020271 | 2025 |
| Russia | Eastern Europe / former USSR | 4237 | 143513328 | 2025 |
| Saudi Arabia | Middle East / North Africa | 917 | 36973555 | 2025 |
| Senegal | Sub-Saharan Africa | 39 | 18931966 | 2025 |
| Serbia | Eastern Europe / former USSR | 115 | 6549143 | 2025 |
| Sierra Leone | Sub-Saharan Africa | 1 | 8819794 | 2025 |
| Singapore | Chinese-language group | 235 | 6111175 | 2025 |
| Slovakia | Eastern Europe / former USSR | 48 | 5413813 | 2025 |
| Slovenia | Eastern Europe / former USSR | 40 | 2130986 | 2025 |
| South Africa | Sub-Saharan Africa | 181 | 64747319 | 2025 |
| South Korea | Other East / Southeast Asia | 1540 | 51684564 | 2025 |
| South Sudan | Sub-Saharan Africa | 19 | 12188788 | 2025 |
| Spain | Western / Northern Europe | 440 | 49355143 | 2025 |
| Sri Lanka | South Asia | 90 | 21756000 | 2025 |
| Sudan | Middle East / North Africa | 183 | 51662147 | 2025 |
| Suriname | Latin America / Caribbean | 3 | 639850 | 2025 |
| Sweden | Western / Northern Europe | 172 | 10596620 | 2025 |
| Switzerland | Western / Northern Europe | 141 | 9092436 | 2025 |
| Syria | Middle East / North Africa | 104 | 25620427 | 2025 |
| Taiwan | Chinese-language group | 720 | 23595274 | GFP 2026 estimate |
| Tajikistan | Eastern Europe / former USSR | 25 | 10786734 | 2025 |
| Tanzania | Sub-Saharan Africa | 38 | 70545865 | 2025 |
| Thailand | Other East / Southeast Asia | 496 | 71619863 | 2025 |
| Tunisia | Middle East / North Africa | 155 | 12348573 | 2025 |
| Turkiye | Middle East / North Africa | 1101 | 85878556 | 2025 |
| Turkmenistan | Eastern Europe / former USSR | 91 | 7618847 | 2025 |
| Uganda | Sub-Saharan Africa | 51 | 51384894 | 2025 |
| Ukraine | Eastern Europe / former USSR | 347 | 38980376 | 2025 |
| United Arab Emirates | Middle East / North Africa | 581 | 11513149 | 2025 |
| United Kingdom | English-speaking group | 625 | 69487000 | 2025 |
| United States | English-speaking group | 13032 | 341784857 | 2025 |
| Uruguay | Latin America / Caribbean | 43 | 3384688 | 2025 |
| Uzbekistan | Eastern Europe / former USSR | 159 | 37053428 | 2025 |
| Venezuela | Latin America / Caribbean | 224 | 28516896 | 2025 |
| Vietnam | Other East / Southeast Asia | 265 | 101598527 | 2025 |
| Yemen | Middle East / North Africa | 160 | 41773878 | 2025 |
| Zambia | Sub-Saharan Africa | 78 | 21913874 | 2025 |
| Zimbabwe | Sub-Saharan Africa | 80 | 16950795 | 2025 |
Nuclear inventories in January 2026
Select a column heading to sort. A dash indicates an unavailable figure, not zero.
Open sortable supporting table
| Country | Deployed warheads | Military stockpile | Total inventory including retired |
|---|---|---|---|
| United States | 1770 | 3700 | 5042 |
| Russia | 1796 | 4400 | 5420 |
| United Kingdom | 120 | 225 | 225 |
| France | 280 | 290 | 370 |
| China | 34 | 620 | 620 |
| India | 12 | 190 | 190 |
| Pakistan | 0 | 170 | 170 |
| North Korea | 0 | 60 | 60 |
| Israel | 0 | 90 | 90 |
Other pages
Sources
- Global Firepower: 2026 air inventories
- World Bank: population, 2025
- Global Firepower: 2026 navy inventories
- IMF: April 2026 WEO, projected purchasing-power-parity GDP
- Global Firepower: 2026 tanks inventories
- Global Firepower: 2026 spa inventories
- Global Firepower: 2026 towed inventories
- Historical aircraft-production series
- Aircraft Industries Association: 1948 Aircraft Year Book
- SIPRI Yearbook 2026: nuclear forces in January 2026
- World Steel Association: World Steel in Figures 2026, production in 2025
- World Steel Association: annual steel production data
- Global Firepower: 2026 fighters inventories
- Global Firepower: 2026 subs inventories
- Global Firepower: 2026 carriers inventories
- Global Firepower: 2026 helicopter carriers inventories
- Global Firepower: 2026 mlrs inventories
- US Navy: Nimitz arrives at final homeport, July 2026
- GlobalSecurity: original naval background source