
Political violence has affected national leaders, legislators, judges and local officials across very different historical settings. This page focuses on recorded assassinations and attempts against political officeholders, using ten charts to explore time, geography and the offices involved. Five existing comparisons are retained and clarified, with five additional views and a large table of selected named cases from 1900 to 2021. Small historical portraits connect three of the comparisons with individual lives. The figures describe their stated compilations; they do not cover every form of political violence, measure motives or provide comparable risks for today’s officeholders.
The existing aggregate charts do not identify their underlying lists or final cutoff dates. Their recent bins are incomplete. The new named-case table is a separate selection, not a reconstruction of those totals. No conclusion about improved security or falling worldwide risk is inferred from the supplied counts.
Statistics
- Recorded leader deaths by decade and region
- Regional shares of the decade compilation
- Recorded failed and fatal attempts since 2000
- US political assassinations by century and office
- Selected locations: domestic and foreign leaders
- Total recorded deaths across decade bins
- Regional composition across three periods
- Offices represented in the US compilation
- Geographical spread and decade totals
- Offices held in the selected historical reference table
- Selected leaders reference table
1. Recorded leader deaths by decade and region
Central / South AsiaE. Europe / former USSRLatin America / CaribbeanMiddle East / N. AfricaNorth AmericaNortheast AsiaOceaniaSoutheast AsiaSub-Saharan AfricaWestern Europe
The decade-by-region chart preserves the page’s main historical comparison while making its counting boundaries explicit. The supplied series contains 136 recorded deaths from the 1900s through an incomplete 2020s category. The largest decade is the 1970s, with twenty entries, followed by the 1980s with sixteen. Colours distinguish the ten regional groups and remain consistent in the next chart, allowing the composition of each column to be followed across time.
These are counts from the existing compilation, whose underlying case list and final observation date were not supplied. They should not be described as a complete current census. A decade with fewer entries may reflect real historical differences, incomplete coverage or decisions about who qualifies as a national leader. Countries also differ in the number of people and years exposed to risk. The chart therefore cannot, by itself, demonstrate that protective security improved or that political institutions became safer. The incomplete final decade is particularly unsuitable for direct comparison with ten-year periods.
Source: existing page chart data, retrieved 20 October 2026. Underlying case list and final observation date not supplied; retained as an incomplete, undated compilation, not a complete current census. 136 entries. Decade bins begin in 1900; 2020s incomplete.
2. Regional shares of the decade compilation
Central / South Asia — 15E. Europe / former USSR — 15Latin America / Caribbean — 14Middle East / N. Africa — 35North America — 2Northeast Asia — 6Oceania — 1Southeast Asia — 6Sub-Saharan Africa — 25Western Europe — 17
The Middle East and North Africa accounts for 35 of the 136 entries in the decade series, or about 25.7%. Sub-Saharan Africa follows with 25, while Western Europe contributes seventeen. The pie uses the same regional colours as the preceding stacked chart and calculates every slice from that chart’s underlying rows. This keeps the two views internally consistent rather than carrying forward conflicting totals.
The earlier standalone pie contained 26 entries for Sub-Saharan Africa, one more than its decade series. The rebuilt pie follows the detailed series and identifies the discrepancy rather than assigning an unexplained extra death to a decade. Regional shares are descriptions of this compilation, not estimates of personal risk. They are affected by historical boundaries, the number of governments covered and the inclusion rules for coups, executions or other violent deaths. A large share cannot establish a single cause across very different events. Individual historical examples can give context, but they should not substitute for a documented case-by-case dataset.
Source: existing page chart data, retrieved 20 October 2026. Underlying case list and final observation date not supplied; retained as an incomplete, undated compilation, not a complete current census. Recalculated from chart 1: Sub-Saharan Africa 25, not the standalone pie’s 26; denominator 136 rather than 137.
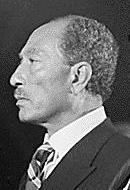
Anwar Sadat provides a historical example from the Middle East and North Africa, the largest regional segment in the chart above. Egypt’s president was assassinated in Cairo in October 1981. This portrait detail comes from a photograph taken at Camp David in September 1978, three years earlier. It connects the regional count with an individual political career rather than illustrating the attack itself. Regional totals combine events with different circumstances and consequences, so one person’s story cannot explain the whole distribution. The photograph is preserved on Wikimedia Commons from a United States government image held by the National Archives. Historical source.
US Executive Office of the President / NARA; Commons crop · Public domain
3. Recorded failed and fatal attempts since 2000
Failed attemptsFatal outcomes
The supplied post-2000 comparison contains 49 failed attempts and seven fatal outcomes across nine regional groups. Eastern Europe and the former Soviet area has the largest failed-attempt count, with twelve; Sub-Saharan Africa follows with ten. Stacking the two categories makes the recorded total visible while keeping fatal and nonfatal outcomes distinct. Grey-blue represents failed attempts and muted red represents recorded assassinations.
The starting year is specified by the earlier page, but the final date and incident list are not. It is also unclear whether repeated attempts against one person are counted separately in every case. For those reasons, the chart should not be turned into a probability of surviving an attack or used to judge the effectiveness of a country’s security services. Alleged plots, intercepted preparations and attacks that actually reach a target can have very different reporting thresholds. The figures are retained as a labelled compilation, without claiming that they include all attempts or every recent incident worldwide.
Source: existing page chart data, retrieved 20 October 2026. Underlying case list and final observation date not supplied; retained as an incomplete, undated compilation, not a complete current census. Starting year 2000; final cutoff unspecified. 49 failed attempts and seven fatal outcomes. Counts are not survival probabilities.
4. US political assassinations by century and office
PresidentsMembers of CongressFederal judgesGovernorsState legislatorsState judgesOther state officesMayors
The American compilation contains 72 entries across eight categories of public office. Its nineteenth-century group is largest, with 37, followed by the twentieth century with 27. State legislators account for a substantial part of the nineteenth-century column. Showing the office categories separately makes clear that this topic extends beyond the four presidential assassinations most familiar to many readers.
The century labels require care. The twenty-first century is incomplete, while the eighteenth-century entry reflects the scope of the supplied list rather than a full century of comparable United States institutions. The underlying definitions and final update date are unavailable. Counts are therefore retained as recorded entries, with no claim that the shorter recent column demonstrates a falling annual risk. The number of officeholders, their terms of service and the reporting of local cases all affect interpretation. Different offices also have different responsibilities and exposure. This chart describes the composition of a historical list; it does not provide a controlled comparison of how dangerous each office was.
Source: existing page chart data, retrieved 20 October 2026. Underlying case list and final observation date not supplied; retained as an incomplete, undated compilation, not a complete current census. 72 entries. Century lengths and coverage differ; twenty-first-century bin incomplete.
5. Selected locations: domestic and foreign leaders
Domestic leadersForeign leaders
The selected country comparison distinguishes leaders representing the country in which they were killed from foreign leaders killed there. Egypt has six entries in the supplied ranking, split into five domestic and one foreign. Afghanistan and Iran each have five domestic entries. France’s total of three includes two foreign leaders, illustrating why the location of an assassination and the nationality or political office of its target must be recorded separately.
This distinction is easy to lose in a simple country league table. An attack during a visit can add to the host country’s count without involving its own head of state or government. The chart keeps the two categories visible and preserves only the seven countries in the earlier selection. It is not a complete ranking of all countries, and its undated coverage should not be presented as current. The reference table later on the page provides separate columns for the represented country and the location country, allowing readers to see that distinction in named historical cases.
Source: existing page chart data, retrieved 20 October 2026. Underlying case list and final observation date not supplied; retained as an incomplete, undated compilation, not a complete current census. Seven selected locations; domestic/foreign follows the source classification.
6. Total recorded deaths across decade bins
Adding the regional segments produces a simpler view of the decade series. The total rises to twenty entries in the 1970s and then falls to sixteen in the 1980s and eleven in the 1990s. The line emphasises changes between successive bins, while the earlier stacked chart remains available for readers who want to see which regional groups contribute to each point. Every value comes from the same 136-entry compilation.
The line joins decade totals, not annual observations. It should not be read as showing a smooth trajectory between the plotted periods. The final category is an incomplete decade, and the source’s update date is unknown. Low recent totals consequently cannot establish that assassination has nearly disappeared or that modern leaders face a particular level of risk. Changes in the number of countries and officeholders would also matter in any rate calculation. The purpose of this additional view is to make the supplied historical pattern easier to read while retaining the limitations that a visually clean trend line can otherwise conceal.
Source: existing page chart data, retrieved 20 October 2026. Underlying case list and final observation date not supplied; retained as an incomplete, undated compilation, not a complete current census. Same 136 entries as chart 1; points are decade totals, not annual rates. Final decade incomplete.
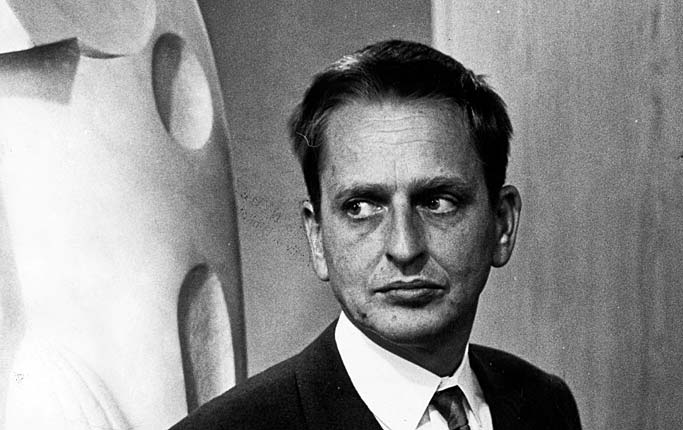
Olof Palme was killed in Stockholm in February 1986 while serving as Sweden’s prime minister. His death is a named example from the 1980s, the decade represented by sixteen entries in the compilation above. Folke Hellberg took this photograph in 1968, well before the assassination. Its inclusion highlights the distance between an individual life and a point on a historical chart. The line shows counts, but cannot convey the consequences for a family, government or wider public. Palme’s case also reminds readers that political assassination has occurred in established European democracies as well as during coups and conflicts elsewhere. Historical study.
Folke Hellberg / Dagens Nyheter · Public domain in Sweden (Commons PD-Sweden-photo)
7. Regional composition across three periods
Central / South AsiaE. Europe / former USSRLatin America / CaribbeanMiddle East / N. AfricaNorth AmericaNortheast AsiaOceaniaSoutheast AsiaSub-Saharan AfricaWestern Europe
Grouping the decade series into three broad periods shows how the regional composition changes within this compilation. The first period covers 1900–1949, the second 1950–1999 and the third the available entries from 2000 onwards. Each bar totals 100%, so its segments describe shares within that period rather than equal numbers of recorded deaths. Europe contributes much more strongly to the early period, while other regions account for a larger part of the later twentieth-century collection.
The periods contain 54, 75 and seven entries respectively. That small final denominator makes each recent entry especially influential: one record represents about 14.3 percentage points. The periods also differ in duration and completeness, so equal-width bars should never be taken to mean equal exposure to risk. Regional groups retain the earlier page’s boundaries, including its combined Eastern Europe and former Soviet category. This chart is a composition comparison within supplied records, not evidence that violence moved neatly from one region to another or that a single historical explanation applies everywhere.
Source: existing page chart data, retrieved 20 October 2026. Underlying case list and final observation date not supplied; retained as an incomplete, undated compilation, not a complete current census. Period denominators: 54, 75 and seven. Periods are unequal in duration and completeness.
8. Offices represented in the US compilation
Presidents — 4Members of Congress — 11Federal judges — 3Governors — 4State legislators — 33State judges — 5Other state offices — 2Mayors — 10
Pooling the American entries by office gives a different perspective from the century chart. State legislators contribute 33 of the 72 recorded entries, the largest category. Members of Congress contribute eleven and mayors ten, while presidents account for four. The doughnut makes the breadth of the list visible, with colours identifying offices rather than political parties or the motives of attackers.
A large count for an office does not mean that an individual officeholder faced the greatest risk. There are many more state legislators and mayors than presidents, and the number serving has changed across history. Calculating comparable risks would require the population of officeholders and their time in office, as well as a complete and consistently defined incident list. None of those denominators is supplied here. The chart instead answers a narrower question: how are the entries in the existing American compilation divided among its eight categories? The presidential portrait below connects one familiar case with that much broader institutional picture.
Source: existing page chart data, retrieved 20 October 2026. Underlying case list and final observation date not supplied; retained as an incomplete, undated compilation, not a complete current census. Same 72 entries as chart 4, pooled across centuries; no officeholder or person-year denominator.

John F. Kennedy is one of the four presidents represented in the American office-category chart above. Cecil Stoughton photographed him in the Oval Office in July 1963, four months before his assassination in Dallas on 22 November. Presidential cases are especially prominent in public memory, but the chart places them within a collection that includes many legislators, judges and mayors. That wider view does not diminish the significance of an individual event. It helps distinguish public familiarity from numerical frequency in a particular list. The JFK Presidential Library documents the Dallas visit and its aftermath; the photograph comes from Wikimedia Commons. Historical source.
9. Geographical spread and decade totals
The scatter plot compares two features of each decade in the regional series. The horizontal axis counts how many of the ten regions have at least one entry; the vertical axis gives the decade’s total recorded deaths. The 1980s spans seven regions, the widest spread in this compilation, while the 1970s has the largest death total across six regions. These are related but distinct descriptions of the data.
A high total can be concentrated in relatively few regions, and a wider geographical spread does not necessarily produce the highest total. The plot helps separate those ideas without introducing a causal trend line. Points represent decade bins, not individual attacks or countries. Some decades share the same coordinates, so they can overlap visually; the supporting data file retains every point and its label. The incomplete 2020s remains a partial observation. As elsewhere, the chart measures the supplied compilation and cannot establish the true worldwide incidence of political violence or compare population-adjusted risks between regions.
Source: existing page chart data, retrieved 20 October 2026. Underlying case list and final observation date not supplied; retained as an incomplete, undated compilation, not a complete current census. One point per decade; exact overlaps possible. Spread counts nonzero regions among the ten source groups.
10. Offices held in the selected historical reference table
The final chart summarises the offices held by the people in the selected historical reference table below. It groups prime ministers and comparable chief ministers as heads of government, kings and emirs as monarchs, and presidents or equivalent national leaders as presidents and heads of state. Every person contributes once, even when more than one leader died in the same event. The categories describe office types rather than political systems or methods of attack.
This is a separate, explicitly selected collection covering cases from 1900 to 2021. It is not the missing case list behind the earlier charts, and its totals should not be expected to reproduce them. The selection provides named examples with year, office, represented country and location, making the history easier to explore. It excludes failed attempts and does not attempt to catalogue every politically motivated death. The count of one office type depends on which examples were selected, so the bars should not be interpreted as showing which form of government is inherently more vulnerable to assassination.
Source: selected entries from historical leader-death compilation. 61 named cases, 1900–2021. Office grouping is editorial; this table is separate from the earlier aggregate data.
11. Selected assassinated leaders, 1900–2021
61 named examples, arranged by year. Scroll across and down for office, represented country and location. This is a selected historical reference, not a complete list, a list of perpetrators, or the case dataset behind charts 1–9. It includes coups and other assassinations; no claim is made that every case has the same legal classification. Years avoid conflating attack dates with later dates of death. Regional groups here are broad editorial groupings based on location, distinct from the older charts.
| Leader | Year | Decade | Office held | Office group | Represented country / polity | City / locality | Location country / polity | Broad location region | Reference |
|---|---|---|---|---|---|---|---|---|---|
| Umberto I | 1900 | 1900s | King | Monarch | Italy | Monza | Italy | Europe | Source list |
| William McKinley | 1901 | 1900s | President | President / head of state | United States | Buffalo | United States | North America | Source list |
| Alexander I of Serbia | 1903 | 1900s | King | Monarch | Serbia | Belgrade | Serbia | Europe | Source list |
| Dimitar Petkov | 1907 | 1900s | Prime minister | Head of government | Bulgaria | Sofia | Bulgaria | Europe | Source list |
| Carlos I of Portugal | 1908 | 1900s | King | Monarch | Portugal | Lisbon | Portugal | Europe | Source list |
| Boutros Ghali | 1910 | 1910s | Prime minister | Head of government | Egypt | Cairo | Egypt | Middle East / North Africa | Source list |
| Pyotr Stolypin | 1911 | 1910s | Prime minister | Head of government | Russian Empire | Kyiv | Russian Empire (now Ukraine) | Europe | Source list |
| Ramón Cáceres | 1911 | 1910s | President | President / head of state | Dominican Republic | Santo Domingo | Dominican Republic | Latin America / Caribbean | Source list |
| José Canalejas | 1912 | 1910s | Prime minister | Head of government | Spain | Madrid | Spain | Europe | Source list |
| George I of Greece | 1913 | 1910s | King | Monarch | Greece | Thessaloniki | Greece | Europe | Source list |
| Sidónio Pais | 1918 | 1910s | President | President / head of state | Portugal | Lisbon | Portugal | Europe | Source list |
| Habibullah Khan | 1919 | 1910s | Emir | Monarch | Afghanistan | Laghman | Afghanistan | Asia | Source list |
| Eduardo Dato | 1921 | 1920s | Prime minister | Head of government | Spain | Madrid | Spain | Europe | Source list |
| António Granjo | 1921 | 1920s | Prime minister | Head of government | Portugal | Lisbon | Portugal | Europe | Source list |
| Hara Takashi | 1921 | 1920s | Prime minister | Head of government | Japan | Tokyo | Japan | Asia | Source list |
| Gabriel Narutowicz | 1922 | 1920s | President | President / head of state | Poland | Warsaw | Poland | Europe | Source list |
| Paul Doumer | 1932 | 1930s | President | President / head of state | France | Paris | France | Europe | Source list |
| Inukai Tsuyoshi | 1932 | 1930s | Prime minister | Head of government | Japan | Tokyo | Japan | Asia | Source list |
| Mohammed Nadir Shah | 1933 | 1930s | King | Monarch | Afghanistan | Kabul | Afghanistan | Asia | Source list |
| Ion G. Duca | 1933 | 1930s | Prime minister | Head of government | Romania | Sinaia | Romania | Europe | Source list |
| Engelbert Dollfuss | 1934 | 1930s | Chancellor | Head of government | Austria | Vienna | Austria | Europe | Source list |
| Alexander I of Yugoslavia | 1934 | 1930s | King | Monarch | Yugoslavia | Marseille | France | Europe | Source list |
| Armand Călinescu | 1939 | 1930s | Prime minister | Head of government | Romania | Bucharest | Romania | Europe | Source list |
| Ahmad Maher Pasha | 1945 | 1940s | Prime minister | Head of government | Egypt | Cairo | Egypt | Middle East / North Africa | Source list |
| Mahmoud El Nokrashy Pasha | 1948 | 1940s | Prime minister | Head of government | Egypt | Cairo | Egypt | Middle East / North Africa | Source list |
| Carlos Delgado Chalbaud | 1950 | 1950s | President | President / head of state | Venezuela | Caracas | Venezuela | Latin America / Caribbean | Source list |
| Haj Ali Razmara | 1951 | 1950s | Prime minister | Head of government | Iran | Tehran | Iran | Middle East / North Africa | Source list |
| Liaquat Ali Khan | 1951 | 1950s | Prime minister | Head of government | Pakistan | Rawalpindi | Pakistan | Asia | Source list |
| José Antonio Remón Cantera | 1955 | 1950s | President | President / head of state | Panama | Panama City | Panama | Latin America / Caribbean | Source list |
| Carlos Castillo Armas | 1957 | 1950s | President | President / head of state | Guatemala | Guatemala City | Guatemala | Latin America / Caribbean | Source list |
| S. W. R. D. Bandaranaike | 1959 | 1950s | Prime minister | Head of government | Ceylon (now Sri Lanka) | Colombo | Ceylon (now Sri Lanka) | Asia | Source list |
| Hazza' Majali | 1960 | 1960s | Prime minister | Head of government | Jordan | Amman | Jordan | Middle East / North Africa | Source list |
| Sylvanus Olympio | 1963 | 1960s | President | President / head of state | Togo | Lomé | Togo | Sub-Saharan Africa | Source list |
| John F. Kennedy | 1963 | 1960s | President | President / head of state | United States | Dallas | United States | North America | Source list |
| Jigme Palden Dorji | 1964 | 1960s | Prime minister | Head of government | Bhutan | Phuntsholing | Bhutan | Asia | Source list |
| Hassan Ali Mansur | 1965 | 1960s | Prime minister | Head of government | Iran | Tehran | Iran | Middle East / North Africa | Source list |
| Abubakar Tafawa Balewa | 1966 | 1960s | Prime minister | Head of government | Nigeria | Lagos | Nigeria | Sub-Saharan Africa | Source list |
| Hendrik Verwoerd | 1966 | 1960s | Prime minister | Head of government | South Africa | Cape Town | South Africa | Sub-Saharan Africa | Source list |
| Abdirashid Shermarke | 1969 | 1960s | President | President / head of state | Somalia | Las Anod | Somalia | Sub-Saharan Africa | Source list |
| Wasfi Tal | 1971 | 1970s | Prime minister | Head of government | Jordan | Cairo | Egypt | Middle East / North Africa | Source list |
| Luis Carrero Blanco | 1973 | 1970s | Prime minister | Head of government | Spain | Madrid | Spain | Europe | Source list |
| Faisal of Saudi Arabia | 1975 | 1970s | King | Monarch | Saudi Arabia | Riyadh | Saudi Arabia | Middle East / North Africa | Source list |
| Sheikh Mujibur Rahman | 1975 | 1970s | President | President / head of state | Bangladesh | Dhaka | Bangladesh | Asia | Source list |
| Park Chung Hee | 1979 | 1970s | President | President / head of state | South Korea | Seoul | South Korea | Asia | Source list |
| Anwar Sadat | 1981 | 1980s | President | President / head of state | Egypt | Cairo | Egypt | Middle East / North Africa | Source list |
| Indira Gandhi | 1984 | 1980s | Prime minister | Head of government | India | New Delhi | India | Asia | Source list |
| Olof Palme | 1986 | 1980s | Prime minister | Head of government | Sweden | Stockholm | Sweden | Europe | Source list |
| Thomas Sankara | 1987 | 1980s | President | President / head of state | Burkina Faso | Ouagadougou | Burkina Faso | Sub-Saharan Africa | Source list |
| Mohamed Boudiaf | 1992 | 1990s | Chairman of the High Council of State | President / head of state | Algeria | Annaba | Algeria | Middle East / North Africa | Source list |
| Ranasinghe Premadasa | 1993 | 1990s | President | President / head of state | Sri Lanka | Colombo | Sri Lanka | Asia | Source list |
| Melchior Ndadaye | 1993 | 1990s | President | President / head of state | Burundi | Bujumbura | Burundi | Sub-Saharan Africa | Source list |
| Juvénal Habyarimana | 1994 | 1990s | President | President / head of state | Rwanda | Kigali | Rwanda | Sub-Saharan Africa | Source list |
| Cyprien Ntaryamira | 1994 | 1990s | President | President / head of state | Burundi | Kigali | Rwanda | Sub-Saharan Africa | Source list |
| Agathe Uwilingiyimana | 1994 | 1990s | Prime minister | Head of government | Rwanda | Kigali | Rwanda | Sub-Saharan Africa | Source list |
| Yitzhak Rabin | 1995 | 1990s | Prime minister | Head of government | Israel | Tel Aviv | Israel | Middle East / North Africa | Source list |
| Vazgen Sargsyan | 1999 | 1990s | Prime minister | Head of government | Armenia | Yerevan | Armenia | Asia | Source list |
| Laurent-Désiré Kabila | 2001 | 2000s | President | President / head of state | Democratic Republic of the Congo | Kinshasa | Democratic Republic of the Congo | Sub-Saharan Africa | Source list |
| Birendra | 2001 | 2000s | King | Monarch | Nepal | Kathmandu | Nepal | Asia | Source list |
| Zoran Đinđić | 2003 | 2000s | Prime minister | Head of government | Serbia | Belgrade | Serbia and Montenegro | Europe | Source list |
| João Bernardo Vieira | 2009 | 2000s | President | President / head of state | Guinea-Bissau | Bissau | Guinea-Bissau | Sub-Saharan Africa | Source list |
| Jovenel Moïse | 2021 | 2020s | President | President / head of state | Haiti | Port-au-Prince metropolitan area | Haiti | Latin America / Caribbean | Source list |
Other pages
Sources and image credits
Source: existing page chart data, retrieved 20 October 2026. Underlying case list and final observation date not supplied; retained as an incomplete, undated compilation, not a complete current census. The regional pie is reconciled to the decade series; the original standalone totals are preserved in the supplied source-data file for transparency. New derived views use the same supplied aggregates. The selected named-case table draws on the linked historical compilation, with JFK Library, US State Department history and the contemporary Palme study supplying context for the pictured examples.
Historical list adaptation: Wikipedia contributors, CC BY-SA 4.0. Commons photographs are credited beside each image; the Sadat portrait is an existing crop. The page’s existing banner is retained.