
INTRODUCTION
Motor vehicle production is an important part of the global economy and provides an indication of a country’s industrial strength, technological capabilities, infrastructure, and manufacturing expertise. Since the middle of the 20th century, the automotive industry has expanded considerably as rising incomes and economic development have increased demand for personal and commercial vehicles. During this period, the geographical distribution of production has also changed significantly, with manufacturing expanding from its traditional centres in North America and Europe to major economies across Asia and other regions. This page presents statistics on global motor vehicle production, including historical trends, regional shares, production by country, and changes in the worldwide automotive manufacturing industry.
Statistics
1. Global Motor Vehicle Production 1970 – 2010 – Trend Column Chart
2. Share of Global Motor Vehicle Production by Region 1970 – 2010 – Trend Column Chart
3. Motor Vehicle Production by Region 1970 – 2010 – Trend Column Chart
4. Top 10 Countries by Motor Vehicle Production in 2025 – Ranked Bar Chart
5. Motor Vehicle Production by Region of World 1950 – 2010 – Data Table
Global motor vehicle production expanded substantially between 1970 and 2010, rising from roughly 29 million vehicles to around 74 million. Western Europe and North America were major centres of production in 1970, but the regional balance changed dramatically over the following four decades. North American output fluctuated and was actually close to its 1970 level again by 2010, while Western Europe remained a consistently important producer.
The most striking change was the rapid growth of East Asia and the Pacific. Production in the region rose from only around six million vehicles in 1970 to more than 35 million by 2010, making it by far the largest manufacturing region. This expansion initially reflected Japan’s automotive industry and was later accelerated by the growth of China and South Korea. Latin America also expanded steadily, while South Asia became increasingly significant by 2010. Overall, the chart illustrates the major eastward shift in global automotive manufacturing.
The chart shows a major shift in the regional distribution of global motor vehicle production between 1970 and 2010. In 1970, Western Europe and North America together accounted for the majority of world output, while East Asia and the Pacific represented a much smaller share. Over the following decades, North America’s proportion generally declined, while Western Europe also lost share despite remaining an important manufacturing centre.
The biggest change was the rapid rise of East Asia and the Pacific. Its share increased steadily through 1980, 1990 and 2000 before becoming the dominant region by 2010, accounting for close to half of global production. This reflected the expansion of Japan and South Korea and, increasingly, the dramatic growth of China’s automotive industry. Latin America also gained a modestly larger share, while South Asia became more visible by 2010. Overall, the chart captures the long-term eastward shift in global vehicle manufacturing.
East Asia has seen a dramatic rise in vehicle production in the 21st century as part of it’s overall economic and manufacturing rise. China is by far the leading country today for motor vehicle production. The rise in East Asian production has driven a bigger global increase in production between 2000 and 2010 compared with growth in previous decades. The modest decline in East Asian production in the last decade of the 20th century was due to a decline in the Japanese car industry and because the Chinese car industry hadn’t yet made up for it. North American production has declined in the 21st century. Other developing regions have also seen an increase in production. As US car manufacturers have moved production facilities to Latin America, mainly Mexico, Latin American production has increased rapidly. Western Europe has also seen a decline between 2000 and 2010 but less than North America in large part because the German car industry remains very strong.
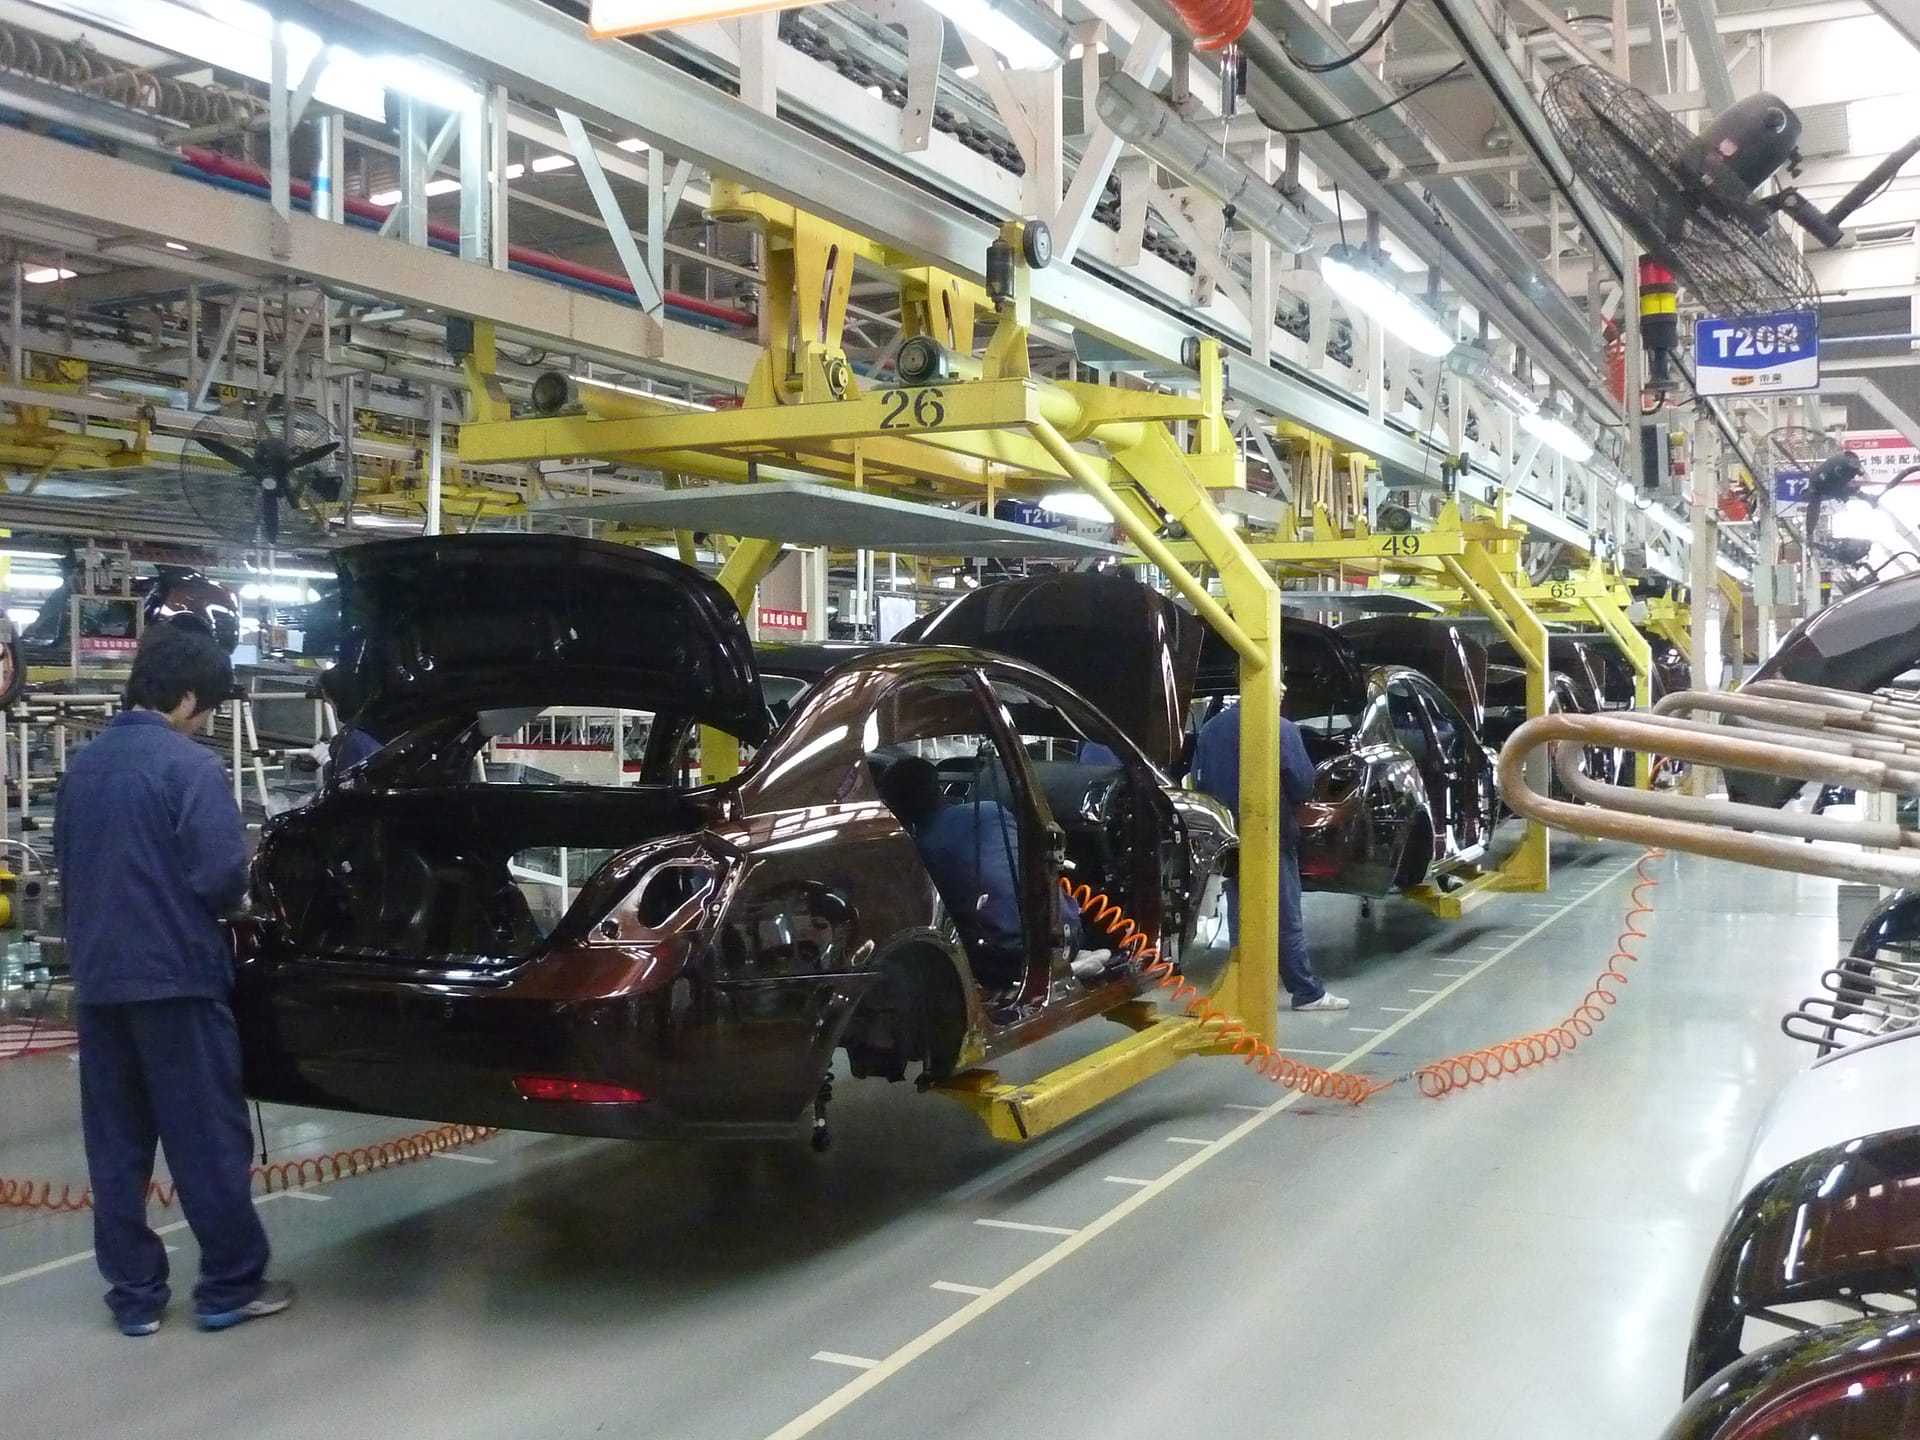
China has developed the world’s largest motor vehicle manufacturing industry, supported by its huge domestic market, extensive supply chains and large-scale industrial capacity. Production expanded rapidly from the 2000s as rising incomes increased car ownership and both domestic and foreign manufacturers invested heavily in Chinese factories. More recently, the industry has become a global leader in electric vehicles, batteries and related technologies, with companies such as BYD, Geely and SAIC becoming increasingly important internationally. China is also a major exporter of vehicles. The sector remains highly competitive, however, with price pressure, overcapacity concerns and trade tensions shaping its future development.
Image: Car assembly line of Geely in Beilun District, Ningbo
China dominates global motor vehicle production in 2025, manufacturing roughly 34–35 million vehicles—more than three times the output of the United States, which ranks second at just over 10 million. Japan remains another major producer at around 8.5 million vehicles, while India follows with approximately 6.5 million, reflecting the rapid expansion of its automotive market and manufacturing base.
Germany, South Korea and Mexico form the next group, each producing around four million vehicles. Germany and South Korea benefit from strong domestic manufacturers, while Mexico has become a major production hub closely integrated with the North American market. Brazil and Spain complete the countries shown at roughly two to three million vehicles each. Overall, the chart illustrates how dramatically the centre of global vehicle manufacturing has shifted towards Asia, with China alone accounting for an exceptionally large share of worldwide production.
5. Motor Vehicle Production by Region of World 1950 – 2010
OTHER PAGES ABOUT INDUSTRY AND CARS
Sources:
https://en.wikipedia.org/wiki/List_of_countries_by_motor_vehicle_production
http://www.oica.net/category/production-statistics/
Ward’s: World Motor Vehicle Data 2007. – Wards Communications, Southfield MI 2007, ISBN 0910589534
Michigan Statistical Abstract 1996. Table XIV-1 – University of Michigan, 1996 ISBN 0-472-08370-8
Image Credits:
Banner image (Car assembly line in Gliwice, Poland) by Marek Ślusarczyk – Licensed Under Creative Commons Attribution 3.0
Car assembly line of Geely in Beilun District, Ningbo by Siyuwj – Licensed under CC BY-SA 3.0