
INTRODUCTION
England are one of the major footballing nations and a World Cup winner in 1966 though widely regarded as one of the biggest underachievers in international football. They have been able to draw from a rich talent pool of players. This page looks at the squads in the England national football team in World Cups and European Championships, which clubs and regions of the country contributed most and other statistics.
Statistics
1. Clubs by Number of Selections for England in Major Tournaments (Bar Chart)
2. Percentage of Black/Mixed Players in England Squads in Major Tournaments (Column Chart)
3. Region of Birth of Players Selected for England in Major Tournaments (Pie Chart)
4. Selections for Different Positions by Region of Birth (Stacked Column Chart)
5. Average Number of Caps Per Player in England Squads (Column Chart)
6. England Squad Members in Major Tournaments by Club (Stacked Column Chart)
7. England Squad Members in Major Tournaments by Region of Birth (Stacked Column Chart)
8. Top 10 England Players by Most Caps (Bar Chart)
9. Harry Kane England Goals by Type (Spider Chart)
10. England Goalkeepers Who Have Played in 2 or More World Cups by World Cup and Overall Clean Sheet % (Bar Chart)
11. Players Selected for England in Major Tournaments by Position, Age, Caps, Club Place of Birth (Data Table)
Manchester United and Liverpool dominate the number of players selected for England at major tournaments up to the 2018 World Cup, with roughly 67 and 66 selections respectively. Their position reflects both their long histories near the top of English football and the large number of leading English players they have produced or signed. Tottenham Hotspur are also particularly prominent, with around 56 selections, well ahead of Arsenal and Chelsea.
The lower half of the ranking shows how historical success matters as much as recent strength. Everton, West Ham, Leeds United and Nottingham Forest all feature despite spending periods away from the very top of English football. Manchester City, meanwhile, have fewer selections than several traditional rivals because much of their modern dominance developed relatively recently and their squads have often contained many overseas players. Overall, the chart reflects the changing relationship between England’s national team and its leading domestic clubs across different eras.
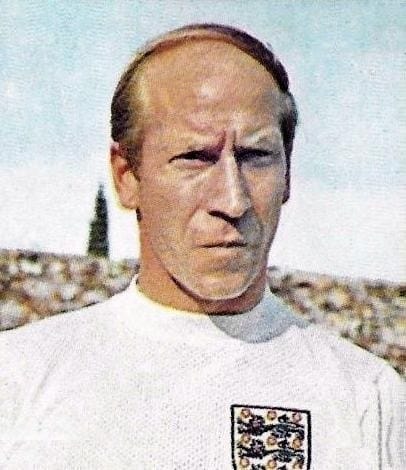
Bobby Charlton is England’s 2nd highest goalscorer of all time (behind Wayne Rooney) with 49 goals. He was one of England’s greatest footballers and a central figure in the country’s 1966 World Cup triumph. An attacking midfielder renowned for his powerful shooting, intelligent movement and composure, Charlton scored three goals during the tournament, including both goals in the semi-final victory over Portugal. At club level he became a Manchester United legend, surviving the 1958 Munich air disaster before helping the club rebuild and win the European Cup in 1968. Charlton also won the Ballon d’Or in 1966. His combination of international success, club achievement and longevity made him one of the defining English players of his generation.
Image: Bobby Charlton
The chart begins in 1982. There has been a gradual rise in the number of black and mixed race players in England squads. A significant point was the 2002 World Cup when England under Sven Goran Ericsson had 39.1% of players who were non-white, nearly triple the previous squad in Euro 2000. Since then, the squad has never had less than 30% non-white players. In the last world cup in Russia, a majority of 52.2% of England players were non-white for the first time. The majority of black and mixed players come from London’s Caribbean communities such as John Barnes who was born in Jamaica and moved to London aged 12.
The North West region has had the most selections with 25.8%. Being the region of Manchester United and Liverpool, this is not surprising. London, the home of Spurs, Chelsea and Arsenal is in 2nd with 22%. The 3rd place region, Yorkshire, is well behind on 10.9%. The dominance of the Northwest and London in English club football is reflected in England selections. The difference in regions in dependent both on the local culture but also on the biggest clubs in the region. Players born in one region are often developed from an early age by a club in another.
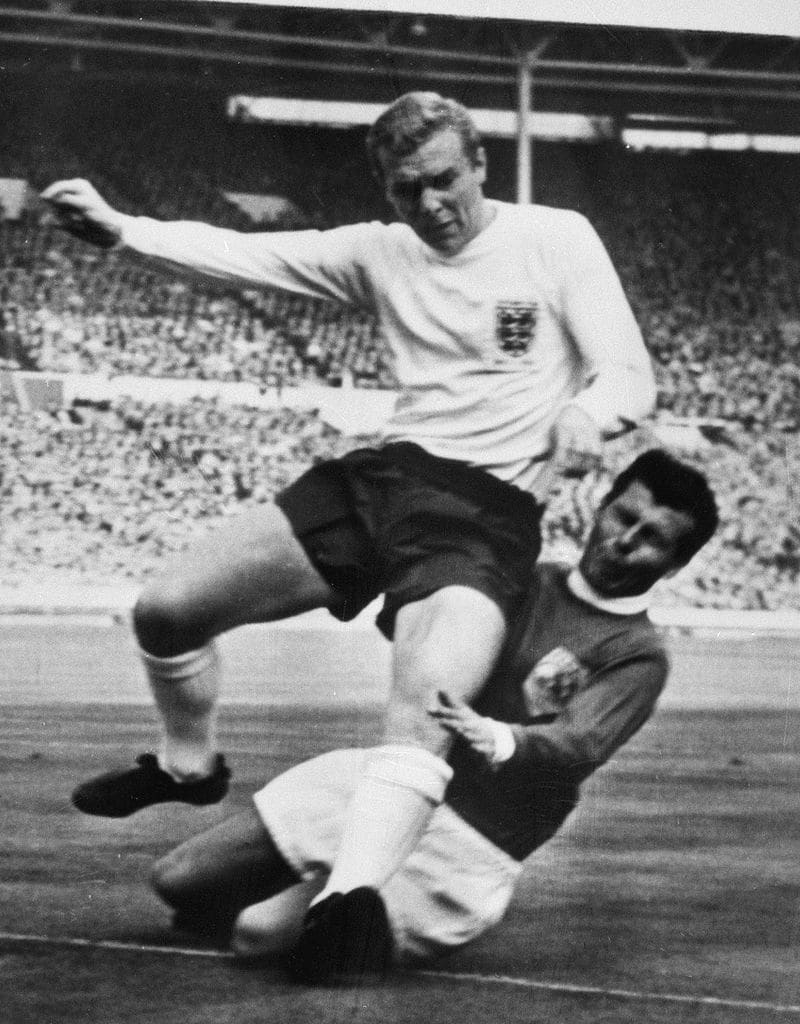
Bobby Moore, from Essex, is considered one of the greatest defenders of all time. He is best remembered as the captain who led England to victory at the 1966 World Cup. A composed and highly intelligent central defender, Moore was admired for his positioning, anticipation and ability to read the game rather than relying on physical aggression. He produced one of his finest performances in the final against West Germany and provided the pass that helped create England’s fourth goal. Moore spent most of his club career with West Ham United, winning the FA Cup and European Cup Winners’ Cup. His calm leadership and technical quality made him one of the most respected defenders of his era and an enduring symbol of England’s greatest football achievement.
Image: Bobby Moore
Photo by Joop Van Bilsen / ANEFO
Licensed under CC BY-SA 3.0 nl
Forwards are far more likely to come from the north and the midlands than the south, particularly from the north. Among northern regions, the northeast has produced the most England forwards on a per capita basis. Two of England’s most famous forwards, Alan Shearer and Bobby Charlton, both hailed from the northeast.
There is more parity for defenders when comparing the southern half of the country with the northern half. Among regions, London and the northwest are completely dominant in producing defenders for England, together accounting for a whopping 67% of defender selections for England. Since these two regions have the most established clubs, it’s likely that they would have a sizeable advantage over other regions in producing players in the less glorious position of defenders.
As with strikers, the northeast produces the most midfielders for England on a per capita basis. Paul Gascoigne, one of England’s most famous midfielders, is from the northeast. Unlike other southern regions, London has a fairly strong record of producing midfielders for England.
For goalkeepers, Yorkshire and the east midlands are the most productive regions. England’s most famous goalkeeper, Gordon Banks, was from Sheffield in Yorkshire. Since there are a relatively small number of goalkeepers, it’s difficult to say if this represents regional superiority in producing goalkeepers or the effects of a small sample.
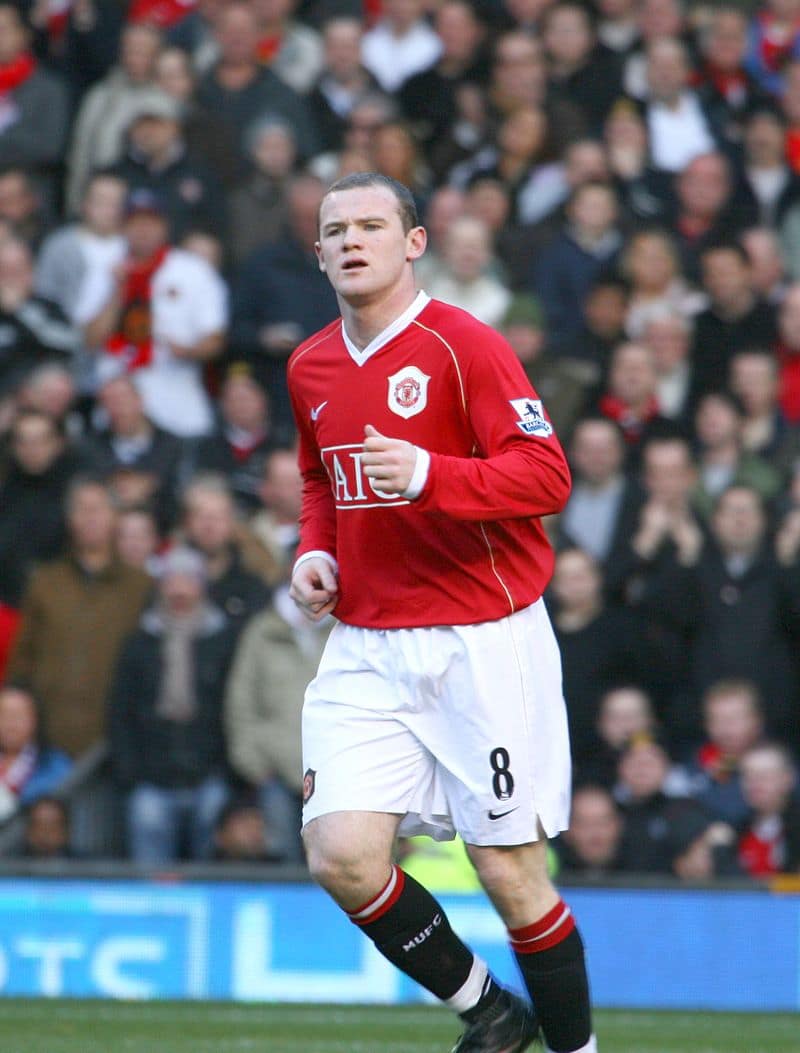
Wayne Rooney was one of England’s leading players of the 21st century and became the country’s record goalscorer before later being overtaken by Harry Kane. He burst onto the international scene as a teenager and was outstanding at Euro 2004, scoring four goals before injury ended his tournament. Rooney went on to earn 120 England caps and score 53 goals, although major tournament success largely eluded his generation. At club level he enjoyed enormous success with Manchester United, winning five Premier League titles and the Champions League. Rooney’s versatility, creativity, physical strength and goalscoring ability allowed him to operate as a striker, second forward or attacking midfielder.
Image: Wayne Rooney
The chart shows a long-term rise in the average international experience of players selected for England at major tournaments. Early World Cup squads were comparatively inexperienced, averaging fewer than 15 caps per player through much of the 1950s and early 1960s. By the late 1960s and 1970s, averages had moved into the low-to-mid 20s, reflecting greater continuity in national-team selection.
Experience peaked in several later tournaments. England’s 1990 and 1992 squads averaged around 30 or more caps per player, while the 2006–2012 period was particularly experienced, reaching a high of roughly 34 caps in 2012. There were also notable drops, including the relatively young 1998 squad. After 2012, the average declined again, falling to just over 20 caps by the 2018 World Cup. Overall, the figures show that England have alternated between relying on established international players and periodically rebuilding with younger, less experienced squads.
The chart shows how the club backgrounds of England’s major-tournament squads have changed from 1950 to 2018. Manchester United and Liverpool are among the most persistent contributors across the period, while Tottenham Hotspur, Arsenal and Chelsea become particularly prominent in certain eras. Manchester City’s contribution grows much more noticeably in the 2010s, reflecting the club’s rise to domestic dominance during that period.
Earlier tournaments contain a much larger share of players from “other” English clubs, suggesting that England selection was once spread more widely across the domestic game. Over time, the squad becomes increasingly concentrated among a smaller group of leading clubs. Players from non-English clubs also appear periodically, especially from the late 1980s onward, although they remain a minority. Overall, the chart reflects the increasing concentration of elite English talent within the country’s biggest clubs, alongside broader changes in the competitive and financial structure of English football.
The chart shows how the regional origins of England’s major-tournament squads have changed over time. London and the North West emerge as particularly important sources of players, especially from the 1990s onward, while the North East also contributes strongly across several tournaments. Earlier squads were often more evenly spread across regions such as Yorkshire, the West Midlands and the East Midlands.
One notable feature is that the balance shifts considerably from tournament to tournament rather than following a single clear long-term pattern. Some regions produce clusters of players during particular eras, reflecting the strength of local academies, clubs and footballing traditions at the time. Wales and non-UK birthplaces appear only occasionally, but their presence shows that England squads have also included players born outside England. Overall, the chart highlights the broad geographical base of the national team, while also showing how certain regions have supplied disproportionate numbers of players in different periods.
Peter Shilton remains England’s most-capped player with 125 appearances, a record built over two decades as the national team’s first-choice goalkeeper. Harry Kane is now close behind with more than 120 caps, while Wayne Rooney reached 120 during a long international career that also saw him become England’s record goalscorer before being overtaken by Kane. David Beckham and Steven Gerrard follow, both exceeding 110 appearances and serving as captains during their careers.
The lower half of the ranking includes several of England’s most celebrated players. Bobby Moore, captain of the 1966 World Cup-winning side, earned 108 caps, while Ashley Cole finished with 107. Bobby Charlton and Frank Lampard both passed the 100-cap mark, and Billy Wright completes the top ten with 105. Overall, the list reflects both longevity and sustained selection at international level, with several players remaining central to England teams across multiple major tournaments.
Harry Kane’s England goals have come predominantly from close-range and central attacking positions, reflecting his role as a traditional number nine as well as a highly reliable penalty taker. Penalties form one of the largest categories in the chart, while a substantial share of his open-play goals have been scored from inside the penalty area but outside the six-yard box. This highlights Kane’s ability to find shooting opportunities in dangerous areas rather than relying heavily on long-range efforts.
Headers also make up a notable part of his international total, demonstrating his strength in the air and effectiveness from crosses and set pieces. Goals from inside the six-yard box are less common, while strikes from outside the penalty area account for only a small proportion. Overall, the distribution shows that Kane’s England scoring record has been built mainly on intelligent positioning, clinical finishing inside the box and exceptional consistency from the penalty spot.
Gordon Banks stands out clearly among England’s long-serving World Cup goalkeepers, keeping clean sheets in roughly two-thirds of his World Cup appearances. This is substantially higher than his overall international clean-sheet rate of around 48%, reflecting his exceptional performances on football’s biggest stage, particularly during England’s successful 1966 campaign. Peter Shilton also improved on his overall record at World Cups, recording a clean-sheet rate of close to 60% compared with just over 50% across all internationals.
David Seaman shows the smallest difference between the two measures, with both his World Cup and overall clean-sheet rates in the mid-50% range, suggesting considerable consistency regardless of competition. Jordan Pickford’s overall England clean-sheet rate is also slightly above 50%. Overall, the chart demonstrates how England’s leading goalkeepers have generally maintained strong defensive records internationally, with Banks particularly notable for raising his clean-sheet percentage considerably during World Cup tournaments.
.
11. Players Selected for England in Major Tournaments by Position, Age, Caps, Club Place of Birth
OTHER PAGES ABOUT FOOTBALL
Sources:
Image Credits:
Banner image (England and Germany entering pitch in 1966 World Cup final) by Unknown Author
Bobby Charlton at 1970 World Cup by Panini
Wayne Rooney by Austin Osuide – Licensed Under CC BY 2.0
Bobby Moore by Joop Van Bilsen / ANEFO – Licensed under CC BY-SA 3.0 nl