
Russia’s war against Ukraine has reshaped lives, borders, public finances and economies. These statistics examine the human cost, displacement, territorial change, international support and the resources committed to fighting. The conflict began in 2014; Russia’s full-scale invasion on 24 February 2022 brought a sharp escalation. Each measure captures a different part of that history.
Source snapshots vary: civilian harm to September 2026; aid to August 2026; territory to October 2026; refugees and military spending through 2025; GDP through 2024. Equipment lists retrieved 12 November 2026. Each chart states its coverage.
Statistics
- How has civilian harm changed month by month?
- How has Russian-occupied territory changed?
- Which countries host the most refugees from Ukraine?
- Who has allocated aid to Ukraine—and what kind?
- How have the Ukrainian and Russian economies changed?
- How many people remain internally displaced?
- How much territory is recorded as Russian-occupied?
- Which events changed the course of the war?
- What equipment losses have been visually documented?
- Where is refugee hosting largest relative to population?
- How much do Russia and Ukraine spend on their militaries?
- International support by donor
1. How has civilian harm changed month by month?
March 2022 stands out for the extraordinary concentration of civilian deaths during the opening assault. The subsequent decline did not mean that civilians became safe: the series rises again, and the 2,570 deaths verified for January–September 2026 already exceed the 2,549 recorded for all of 2025. Injuries also increased sharply. OHCHR attributes much of the recent harm to long-range missiles and drones, alongside short-range drones near the front. These weapons expose both frontline communities and distant cities to danger. The numbers describe confirmed cases; limited access to occupied areas means the true human toll is higher.
Sources: OHCHR — Protection of civilians, September 2026. 24 February 2022–30 September 2026, monthly cases from the September 2026 OHCHR report, including its revisions to earlier months. Deaths and injuries are separate views, not military casualties. Verified minimum counts within Ukraine’s internationally recognised territory; actual totals are higher, particularly in inaccessible occupied areas. January–September 2026 is not a complete year.
2. How has Russian-occupied territory changed?
■ Russian-occupied territory in the source archive. Grey: outside that mapped area. Ukraine’s internationally recognised borders include Crimea. Broad historical overview; not a live frontline map.
The occupied area forms a broad belt across eastern and southern Ukraine, connecting occupied Crimea with Russian-held territory in the Donbas. Across these snapshots, the outline changes more gradually than it did during the dramatic campaigns of 2022. Yet modest changes on a national map can mean the loss of towns, homes, farmland and transport links. Territorial control also affects whether residents can return and whether businesses can operate safely. The archive shows Russia’s occupied area expanding over this period, but it cannot tell us the human or military cost of each advance, or how secure any particular position is.
Sources: DeepState historic occupation polygons — cyterat archive; Natural Earth — national outline. Ten archive snapshots, 8 July 2024–1 October 2026. Dates are archive update dates, not necessarily the exact date control changed. Source: DeepState polygons preserved by cyterat; attribution is not independent verification. Crimea is included. Grey does not resolve contested or uncertain control. The archive used here does not cover the 2022 counteroffensives. Display boundaries are simplified; the area calculation uses the original polygons.
3. Which countries host the most refugees from Ukraine?
Germany and Poland host the largest numbers in this end-2025 refugee series: about 1.17 million and 972,000 respectively. Together they account for roughly two-fifths of the 5.22 million people recorded in this particular statistical category. Neighbouring countries were accessible first destinations, while larger economies offered opportunities for work, education and longer-term settlement. Czechia’s high total is especially striking given its smaller population. The pattern shows how an emergency flight from danger becomes a continuing need for housing, schools and public services. These figures cover UNHCR’s refugee category, not every Ukrainian living abroad or every person with another protection status.
Sources: UNHCR — Refugee Population Statistics. Top 15 hosts by the UNHCR annual population API’s refugees field, Ukraine origin, end-2025. Includes the source’s refugee and refugee-like/temporary-protection coverage; excludes asylum seekers, other people in need of international protection and other categories. This is not the broader operational count of all refugees from Ukraine or a count of all Ukrainians abroad. National status rules and reporting coverage differ, especially for Russia and the United States. Data are stocks, not cumulative border crossings.

A railway station becomes a place of refuge
Przemyśl’s railway station in Poland became part of the route out of Ukraine after the full-scale invasion. This photograph, taken in April 2022, captures the human setting behind the host-country totals: people in transit, waiting and trying to decide what comes next. An arrival point does not necessarily become a permanent home. Some people continue to other countries, while others later return. That is why border crossings and refugee populations answer different questions. The longer displacement lasts, the more the response needs to provide stable accommodation, schooling, work and access to healthcare alongside immediate emergency assistance.
Photo: Refugees inside Przemyśl Główny station — 梁柏堅 Pakkin Leung, 17 April 2022, CC BY 4.0, via Wikimedia Commons. Displayed smaller, uncropped.
4. Who has allocated aid to Ukraine—and what kind?
The United States is the largest individual donor in cumulative allocations, while EU institutions are another major source, particularly of financial support. Their different mixes reveal complementary roles: military assistance supplies defence needs, financial assistance helps sustain government functions, and humanitarian assistance addresses immediate civilian needs. Large economies dominate the euro totals, but Denmark, Estonia and several other northern European countries stand out when allocations are compared with their own economic size. The cumulative view also reflects earlier decisions, so it should not be mistaken for a ranking of current monthly support. Continued assistance depends on political choices as well as economic capacity.
Sources: Kiel Institute — Ukraine Support Tracker, release 31. Kiel release 31: allocations from 24 January 2022 through 31 August 2026, nominal € billion. Allocations identify aid delivered or earmarked for delivery, not a claim that every item has arrived. Includes grants, loans and valued in-kind assistance under the tracker’s methodology; excludes private donations and domestic refugee-hosting costs. EU Commission/Council shown separately, without redistributing its aid into national totals. Relative view excludes EU institutions and divides cumulative allocations by donor GDP in 2021; it is not annual aid/GDP.
5. How have the Ukrainian and Russian economies changed?
Ukraine’s economy contracted sharply after the full-scale invasion and remained about 22% below its 2021 output in 2024, despite renewed growth. Destruction, displacement and disruption to production and trade help explain why recovery from such a deep fall takes time. Russia’s economy followed a different path: a smaller initial decline was followed by growth above its pre-invasion level. That divergence does not measure who is better off in every sense. Military production contributes to GDP, while damaged homes, lost lives and reduced security are not captured adequately by output alone. Ukraine’s earlier decline also shows that the economic consequences of the conflict began before 2022.
Sources: World Bank — real GDP; UN Ukraine — humanitarian and economic damage assessment. World Bank NY.GDP.MKTP.KD, 2013–2024, constant-price GDP rebased separately for each country to 2021 = 100. Latest common year in this extract: 2024. No forecasts. Indices compare output changes, not the countries’ economic sizes, household incomes or welfare. Wartime territorial coverage and national-accounts revisions affect interpretation.
6. How many people remain internally displaced?
Internal displacement rose from about 854,000 people at the end of 2021 to 5.91 million a year later. The fall during 2023 was substantial, but the following two years remained close to 3.7 million: displacement had become a prolonged condition for millions of people. A lower total can reflect returns, movement abroad or changes in estimation; it does not establish that everyone leaving the count found a safe, durable home. Continuing attacks and damaged housing can prevent return even when fighting moves elsewhere. The broadly stable recent total can also conceal new evacuations alongside returns, leaving the needs of individual communities constantly changing.
Sources: UNHCR — Refugee Population Statistics; IDMC — internal displacement in Ukraine. UNHCR annual population statistics, Ukraine origin and location, year-end 2021–2025, idps field. Estimated people remaining internally displaced, not new displacement events or administrative registrations. Annual snapshots omit the within-year peak in 2022. Changes include returns, further movement and estimation/coverage changes; they cannot be interpreted entirely as safe returns. Source precision is retained in chart-data.json.
7. How much territory is recorded as Russian-occupied?
The archived occupied area grows from approximately 109,100 square kilometres in July 2024 to 116,800 in October 2026—an increase of about 7,700 square kilometres. This is cumulative change over more than two years, rather than a sudden shift. Gains appear faster in parts of 2024 and 2025 than in the later snapshots, though a few observations cannot capture every local reversal. The pattern illustrates how repeated advances can add up even when daily reports describe small movements. Area alone is an incomplete measure of significance: a town, river crossing or transport route may matter far more than an equivalent expanse of open land.
Sources: DeepState historic occupation polygons — cyterat archive. Same DeepState archive and ten dates as chart 2. Approximate spherical polygon area using mean Earth radius 6,371.0088 km; holes subtracted, original unsimplified geometry, rounded to the nearest 100 km² for display. Includes Crimea and all territory classified as occupied by the source, regardless of when it was occupied. Change view subtracts 8 July 2024, not the start of the invasion. Map revisions and uncertain front lines affect estimates; no claim of survey precision.
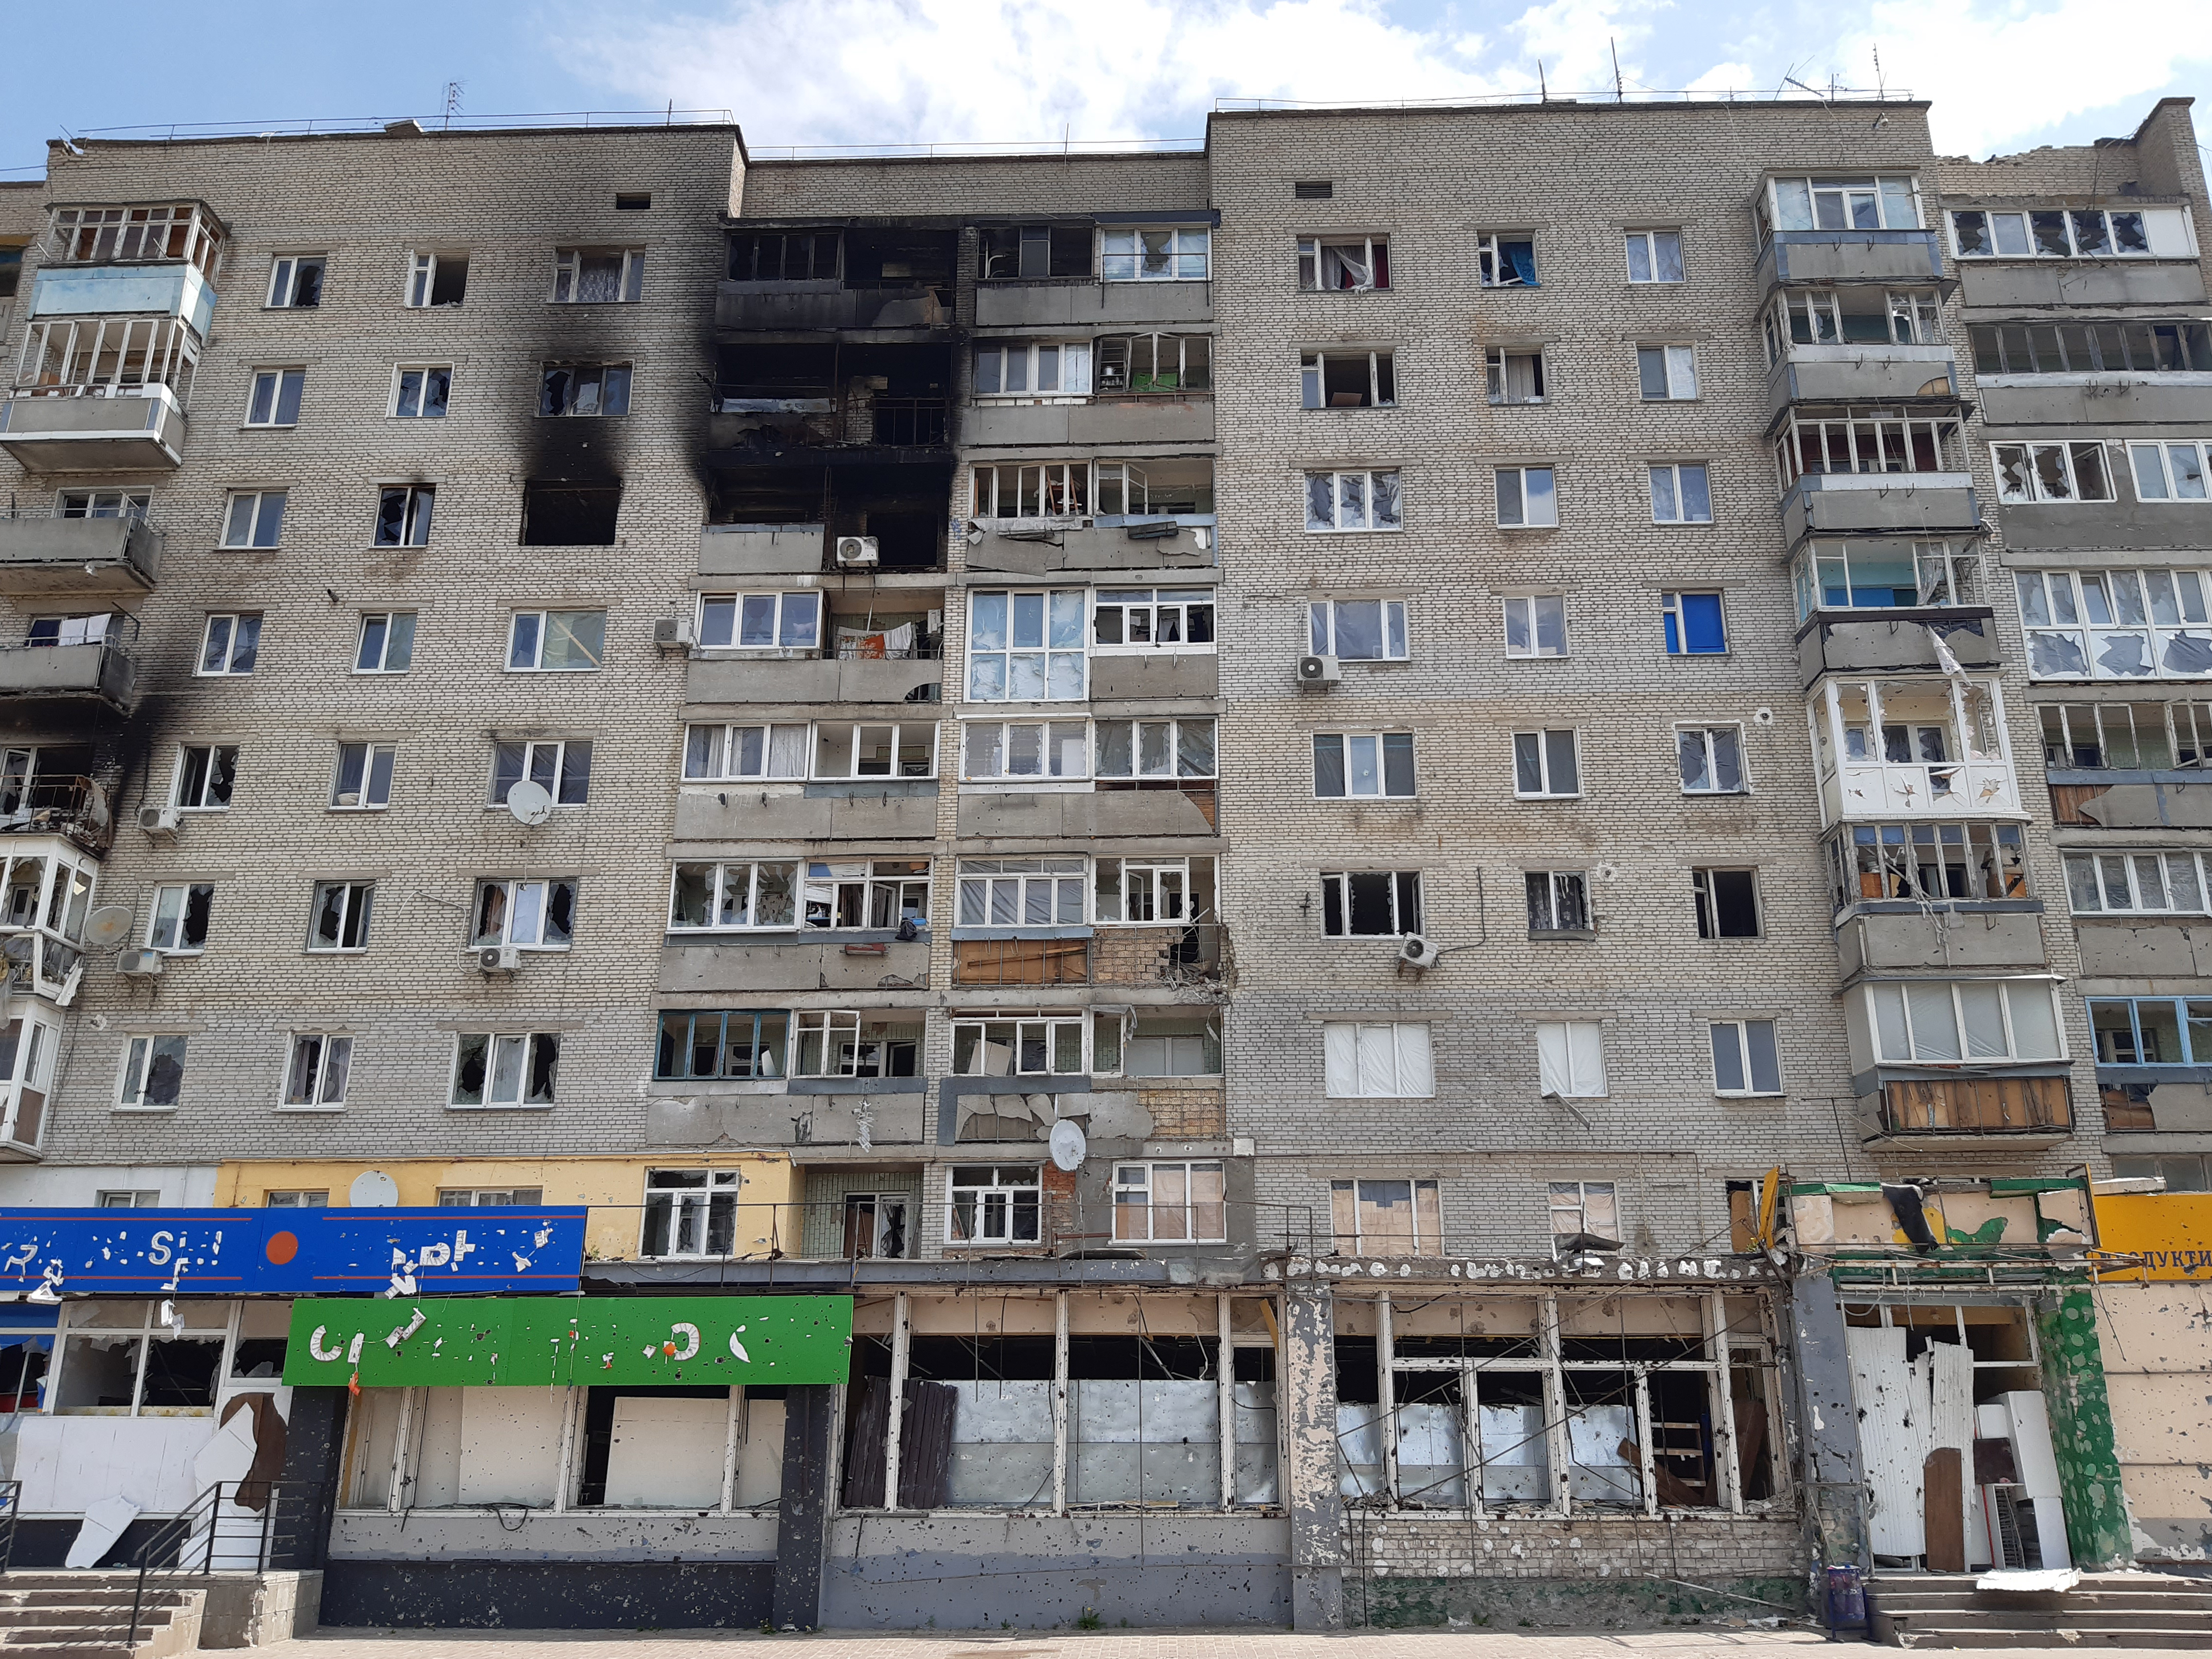
Recovery extends beyond the front line
This damaged apartment building in Irpin was photographed in May 2022, after Russian forces withdrew from the area around Kyiv. Recovering territory does not immediately restore the homes and services that made everyday life possible. Families may still face repairs, lost belongings, disrupted employment and uncertainty about safety. The photograph helps explain why displacement and economic damage can persist after a change in military control. Rebuilding housing is also connected to restoring utilities, transport, schools and livelihoods. Those practical conditions shape whether residents can return and whether a recovery in national output is felt in their own neighbourhood.
Photo: Irpin after Russian invasion (2022-05-08) — Rasal Hague, 8 May 2022, CC BY-SA 4.0, via Wikimedia Commons. Displayed smaller, uncropped.
8. Which events changed the course of the war?
Hover, tap or choose an item for detailed values.
The sequence makes clear that February 2022 was an escalation of an existing war, rather than its beginning. It also shows why the conflict cannot be understood as uninterrupted movement in one direction: early Russian advances were followed by major Ukrainian recoveries, while diplomatic agreements briefly reopened some economic routes without ending the fighting. The destruction of the Kakhovka dam demonstrates how a single event can create humanitarian and environmental consequences far beyond the immediate battlefield. These selected milestones provide context for the other charts; they do not imply that territorial gains, negotiations or economic adaptation brought the wider conflict to a close.
Sources: House of Commons Library — conflict timeline, 2014–2022; House of Commons Library — conflict timeline, 2022 onward; UN — Kakhovka dam destruction; IMO — Black Sea Grain Initiative. Selected historical milestones, 2014–August 2024, not an exhaustive or current news timeline. Rows follow chronology; vertical spacing does not represent elapsed time. The 2022 invasion followed eight years of conflict. Annexation claims do not change the internationally recognised borders shown elsewhere on this page.
9. What equipment losses have been visually documented?
Infantry fighting vehicles, tanks and trucks account for large numbers of documented Russian losses; Ukraine also shows substantial losses across armour, transport and artillery. The pattern underlines that sustaining an army requires replacing far more than its most prominent weapons. Transport losses can disrupt supply, while damage to artillery and armoured vehicles affects the ability to support ground operations. Destroyed equipment dominates many categories, but damaged or captured items have different implications for future availability. The two sides’ documented totals should not be treated as a complete exchange ratio: visibility, publication and verification differ, and these records do not show remaining inventories or replacement rates.
Sources: Oryx — documented Russian equipment losses; Oryx — documented Ukrainian equipment losses. Oryx pages retrieved 12 November 2026. Thirteen selected, mutually exclusive categories; not the all-equipment total. Each entry requires photographic or video evidence under the source’s rules. Counts are minimum documented losses, not official claims, personnel casualties or remaining inventories. Damaged and abandoned equipment may be recovered; categories can be revised. Do not add the source’s armoured-combat-vehicle subtotal to its component categories.
10. Where is refugee hosting largest relative to population?
Population changes the perspective on hosting. Moldova leads this comparison at roughly 62 recorded refugees per 1,000 residents, ahead of Czechia at 36. Germany, despite having the largest absolute total, is closer to 14 per 1,000. Small countries can therefore face substantial housing, school and healthcare demands even when their headline numbers look modest. Geography helps explain the prominence of nearby hosts, while existing connections and access to work can influence where people settle. This ratio describes the scale of recorded hosting relative to population, not a complete assessment of national effort: resources, local concentration and the support available to refugees also matter.
Sources: UNHCR — Refugee Population Statistics; World Bank — population. Top 15 ratios among hosts with a positive end-2025 UNHCR refugees count and available World Bank 2024 population. Same refugee category as chart 3. Ratio = refugees / resident population × 1,000. Population and refugee dates differ by one year; country coverage can also differ, notably Cyprus and Moldova. This is an approximate comparison, not the share of all residents who are refugees or a measure of financial burden. Small states retained.
11. How much do Russia and Ukraine spend on their militaries?
Both countries sharply increased military spending after 2021, but the economic burden is very different. In 2025 Russia spent about US$158 billion at 2024 prices, compared with Ukraine’s US$78 billion. Relative to GDP, however, Ukraine’s expenditure was almost 40%, against about 7.5% for Russia. That contrast shows how a smaller economy can devote a much larger share of its resources to defence while still spending less in absolute terms. Such demands constrain other public priorities and make external support particularly consequential for Ukraine. Spending is not a direct measure of combat power: prices, procurement, donated equipment and the effectiveness of expenditure all affect what the money provides.
Sources: SIPRI — Military Expenditure Database, 1949–2025. SIPRI 1949–2025 workbook, constant (2024) US$ and Share of GDP sheets, years 2014–2025. Dollar amounts divided by 1,000 from millions to billions; stored GDP fractions multiplied by 100. Includes source estimates and wartime uncertainty. Military assistance is normally counted in the donor’s expenditure, not as the recipient’s own expenditure; this is not the full value of military resources available to Ukraine. Constant-dollar spending uses 2024 prices and exchange rates, not purchasing-power parity.
International support for Ukraine by donor
Table 2 • All 42 donor entries in Kiel’s country summary. Cumulative bilateral allocations, 24 January 2022–31 August 2026, € billion. EU Commission/Council is separate. GDP comparison uses each country’s 2021 GDP; an em dash means not applicable for the institutional entry. Search a donor or click a heading to sort.
| United States | 64.617 | 47.297 | 3.467 | 115.381 | 0.585 |
|---|---|---|---|---|---|
| EU (Commission and Council) | 8.874 | 87.609 | 3.283 | 99.766 | — |
| Germany | 25.004 | 1.663 | 4.175 | 30.841 | 0.856 |
| United Kingdom | 16.184 | 5.154 | 1.464 | 22.802 | 0.861 |
| Canada | 5.816 | 8.424 | 0.610 | 14.851 | 0.883 |
| Japan | 0.076 | 12.638 | 1.708 | 14.421 | 0.345 |
| Denmark | 10.538 | 0.215 | 0.990 | 11.744 | 3.487 |
| Norway | 7.461 | 2.043 | 2.026 | 11.530 | 2.828 |
| Sweden | 9.275 | 1.004 | 1.050 | 11.329 | 2.108 |
| Netherlands | 9.357 | 0.716 | 1.126 | 11.199 | 1.308 |
| France | 6.232 | 0.799 | 0.876 | 7.907 | 0.316 |
| Poland | 4.452 | 0.928 | 0.506 | 5.886 | 1.025 |
| Italy | 3.000 | 0.475 | 0.831 | 4.306 | 0.242 |
| Finland | 3.337 | 0.159 | 0.307 | 3.804 | 1.513 |
| Belgium | 2.836 | 0.049 | 0.412 | 3.297 | 0.656 |
| Spain | 1.507 | 0.791 | 0.315 | 2.613 | 0.217 |
| Lithuania | 1.209 | 0.051 | 0.231 | 1.492 | 2.655 |
| Switzerland | 0.000 | 0.225 | 1.222 | 1.447 | 0.214 |
| Australia | 0.912 | 0.000 | 0.161 | 1.073 | 0.082 |
| Estonia | 0.888 | 0.010 | 0.066 | 0.964 | 3.066 |
| Slovakia | 0.696 | 0.036 | 0.020 | 0.752 | 0.764 |
| Latvia | 0.652 | 0.047 | 0.029 | 0.729 | 2.162 |
| Czechia | 0.578 | 0.000 | 0.060 | 0.638 | 0.268 |
| Ireland | 0.309 | 0.047 | 0.282 | 0.638 | 0.150 |
| South Korea | 0.015 | 0.201 | 0.343 | 0.558 | 0.036 |
| Romania | 0.414 | 0.000 | 0.123 | 0.537 | 0.224 |
| Portugal | 0.382 | 0.000 | 0.003 | 0.385 | 0.180 |
| Luxembourg | 0.239 | 0.001 | 0.136 | 0.376 | 0.520 |
| Croatia | 0.276 | 0.001 | 0.098 | 0.375 | 0.643 |
| Austria | 0.003 | 0.120 | 0.137 | 0.260 | 0.064 |
| Bulgaria | 0.254 | 0.000 | 0.002 | 0.256 | 0.360 |
| Slovenia | 0.159 | 0.000 | 0.026 | 0.186 | 0.355 |
| Greece | 0.169 | 0.000 | 0.000 | 0.169 | 0.093 |
| Iceland | 0.057 | 0.013 | 0.031 | 0.101 | 0.467 |
| New Zealand | 0.036 | 0.005 | 0.042 | 0.082 | 0.039 |
| Turkiye | 0.066 | 0.000 | 0.005 | 0.071 | 0.010 |
| Taiwan | 0.000 | 0.004 | 0.053 | 0.057 | 0.009 |
| Hungary | 0.000 | 0.000 | 0.054 | 0.054 | 0.035 |
| Cyprus | 0.000 | 0.001 | 0.003 | 0.004 | 0.017 |
| India | 0.000 | 0.000 | 0.003 | 0.003 | 0.000 |
| China | 0.000 | 0.000 | 0.002 | 0.002 | 0.000 |
| Malta | 0.000 | 0.000 | 0.002 | 0.002 | 0.015 |
Source: Kiel Ukraine Support Tracker, release 31, Country Summary (€). Allocations include delivered aid and aid earmarked for delivery. Loans, grants and valued in-kind aid follow the tracker’s definitions. Values are rounded; 0.000 can mean a non-zero amount below €0.5 million. National rows exclude attributed EU shares, so institutional aid is not counted twice. Domestic refugee-hosting costs and private donations are excluded.
Other pages
Sources and image credits
Data sources: OHCHR — Protection of civilians, September 2026; DeepState historic occupation polygons — cyterat archive; UNHCR — Refugee Population Statistics; Kiel Institute — Ukraine Support Tracker, release 31; World Bank — real GDP; House of Commons Library — conflict timeline, 2014–2022; House of Commons Library — conflict timeline, 2022 onward; Oryx — documented Russian equipment losses; Oryx — documented Ukrainian equipment losses; World Bank — population; SIPRI — Military Expenditure Database, 1949–2025; Natural Earth — national outline; UN Ukraine — humanitarian and economic damage assessment; IDMC — internal displacement in Ukraine; UN — Kakhovka dam destruction; IMO — Black Sea Grain Initiative. Retrieved 12 November 2026. Calculations and visualisations by The World in Stats. Body photographs: Refugees inside Przemyśl Główny station — 梁柏堅 Pakkin Leung, 17 April 2022, CC BY 4.0, via Wikimedia Commons. Irpin after Russian invasion (2022-05-08) — Rasal Hague, 8 May 2022, CC BY-SA 4.0, via Wikimedia Commons.