THE WORLD IN STATS
The World in Stats is a visual reference library for understanding the world through statistics. It brings together data from a wide range of subjects and presents it through charts, maps, rankings, timelines and concise analysis.
Explore how countries compare, how records have changed, which people and institutions lead their fields, and how patterns differ across regions and periods of history. The collection spans subjects including business, sport, science, infrastructure, politics, healthcare, culture, entertainment, nature and history. Some pages examine major global trends, while others uncover unusual records, surprising comparisons and patterns hidden within familiar subjects.
The collection is continually expanding, with new datasets, visualisations and analysis added across a growing range of subjects. Whether you are researching a topic or simply curious about how the world works, The World in Stats provides an accessible way to discover the stories behind the numbers.
Featured Stats
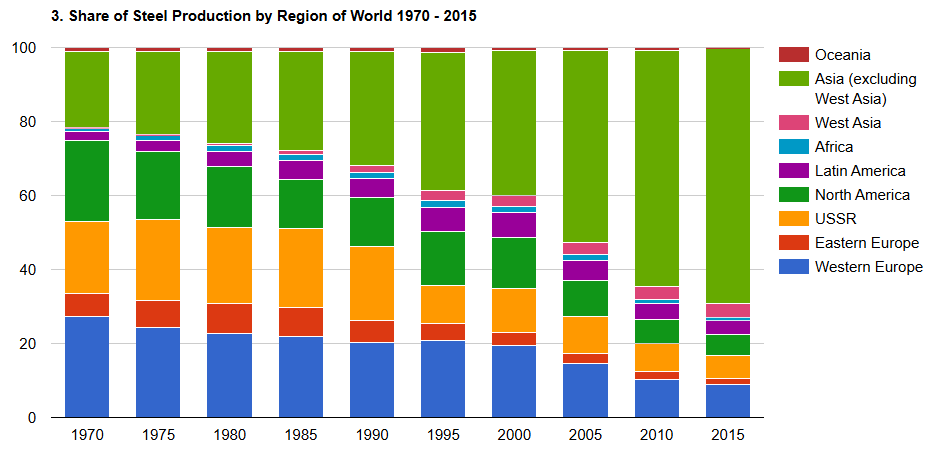
This chart shows how the share of global steel production has changed dramatically since 1970 with Asia, driven by China, now accounting for the majority of steel production. For interactive charts and a more detailed analysis and other charts about Steel Production, click on image.
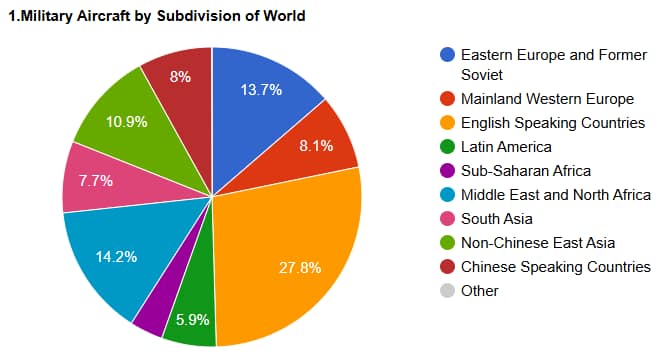
This chart shows how the world’s military aircraft are distributed across major regions, with English-speaking countries accounting for the largest share, mainly due to the United States Air Force. For interactive charts and a more detailed analysis and other charts about military equipment by countries and regions, click on image.

The chart shows the top 10 teams by squad market value at the 2026 World Cup and how their market values are distributed by position. The winners Spain show a relatively even distribution of value at different positions. For interactive charts and a more detailed analysis and other charts about the FIFA World Cup, click on image.